
Three-Building Data Center Campus — South Central US
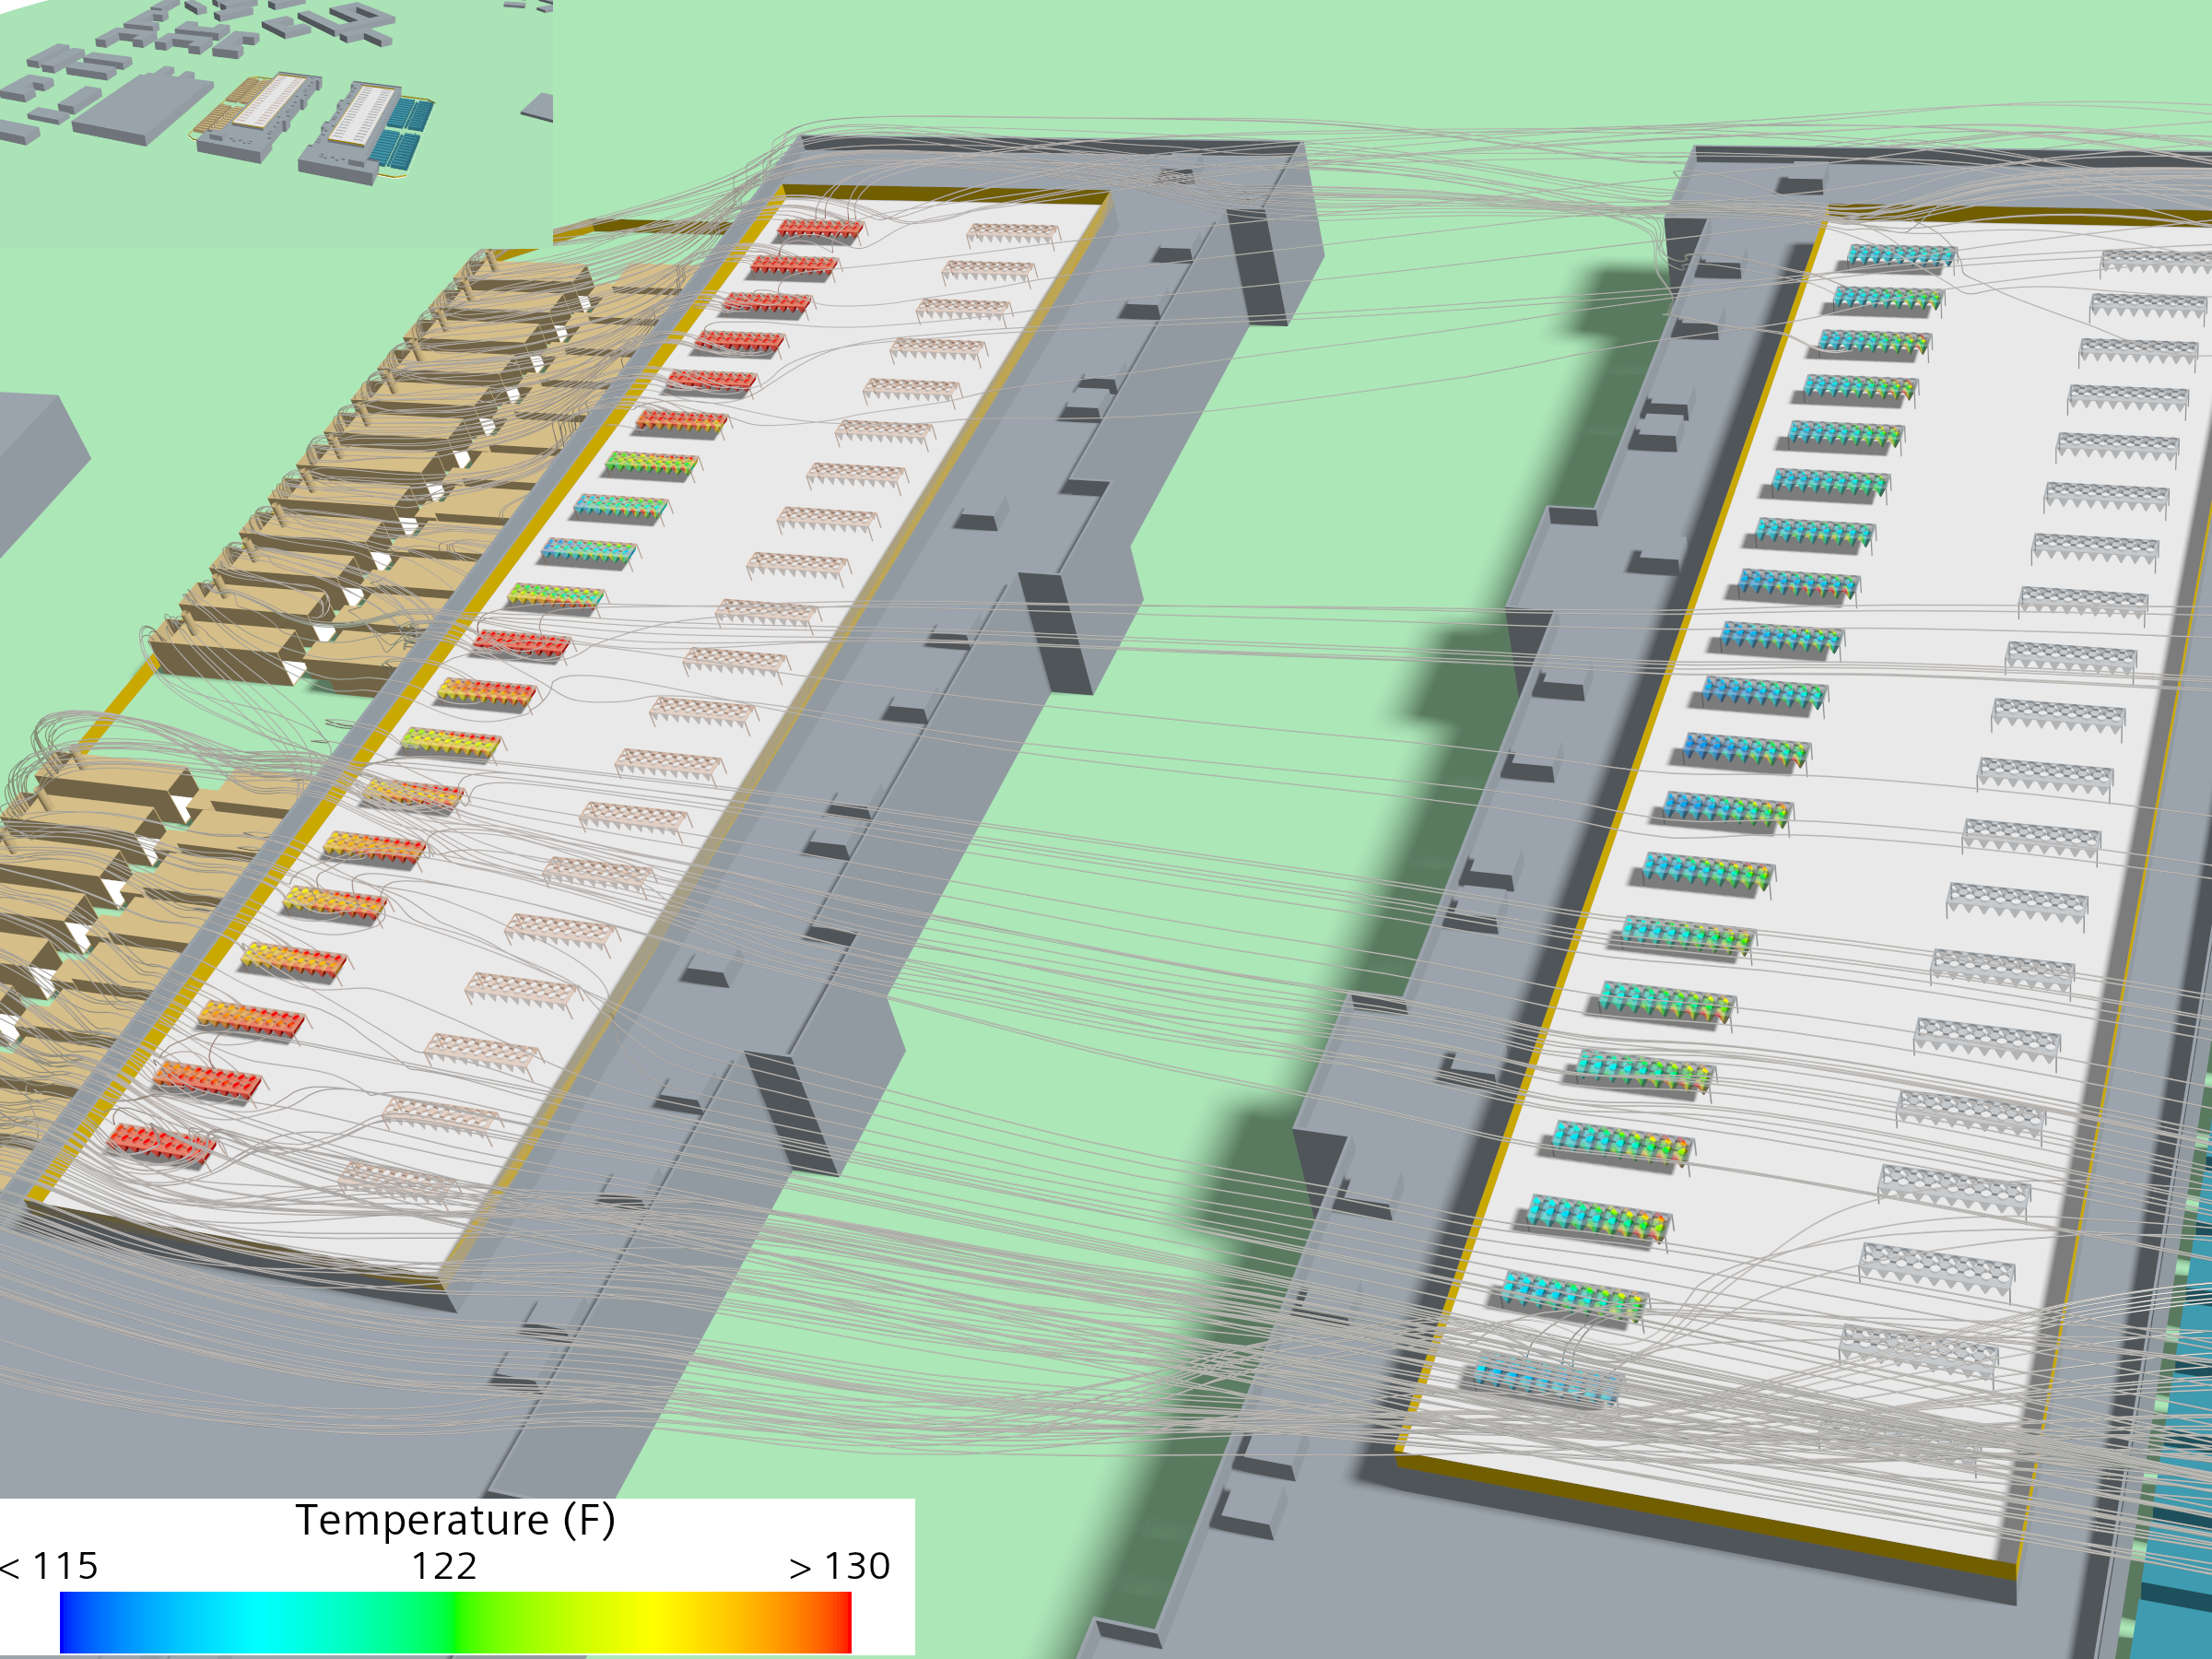
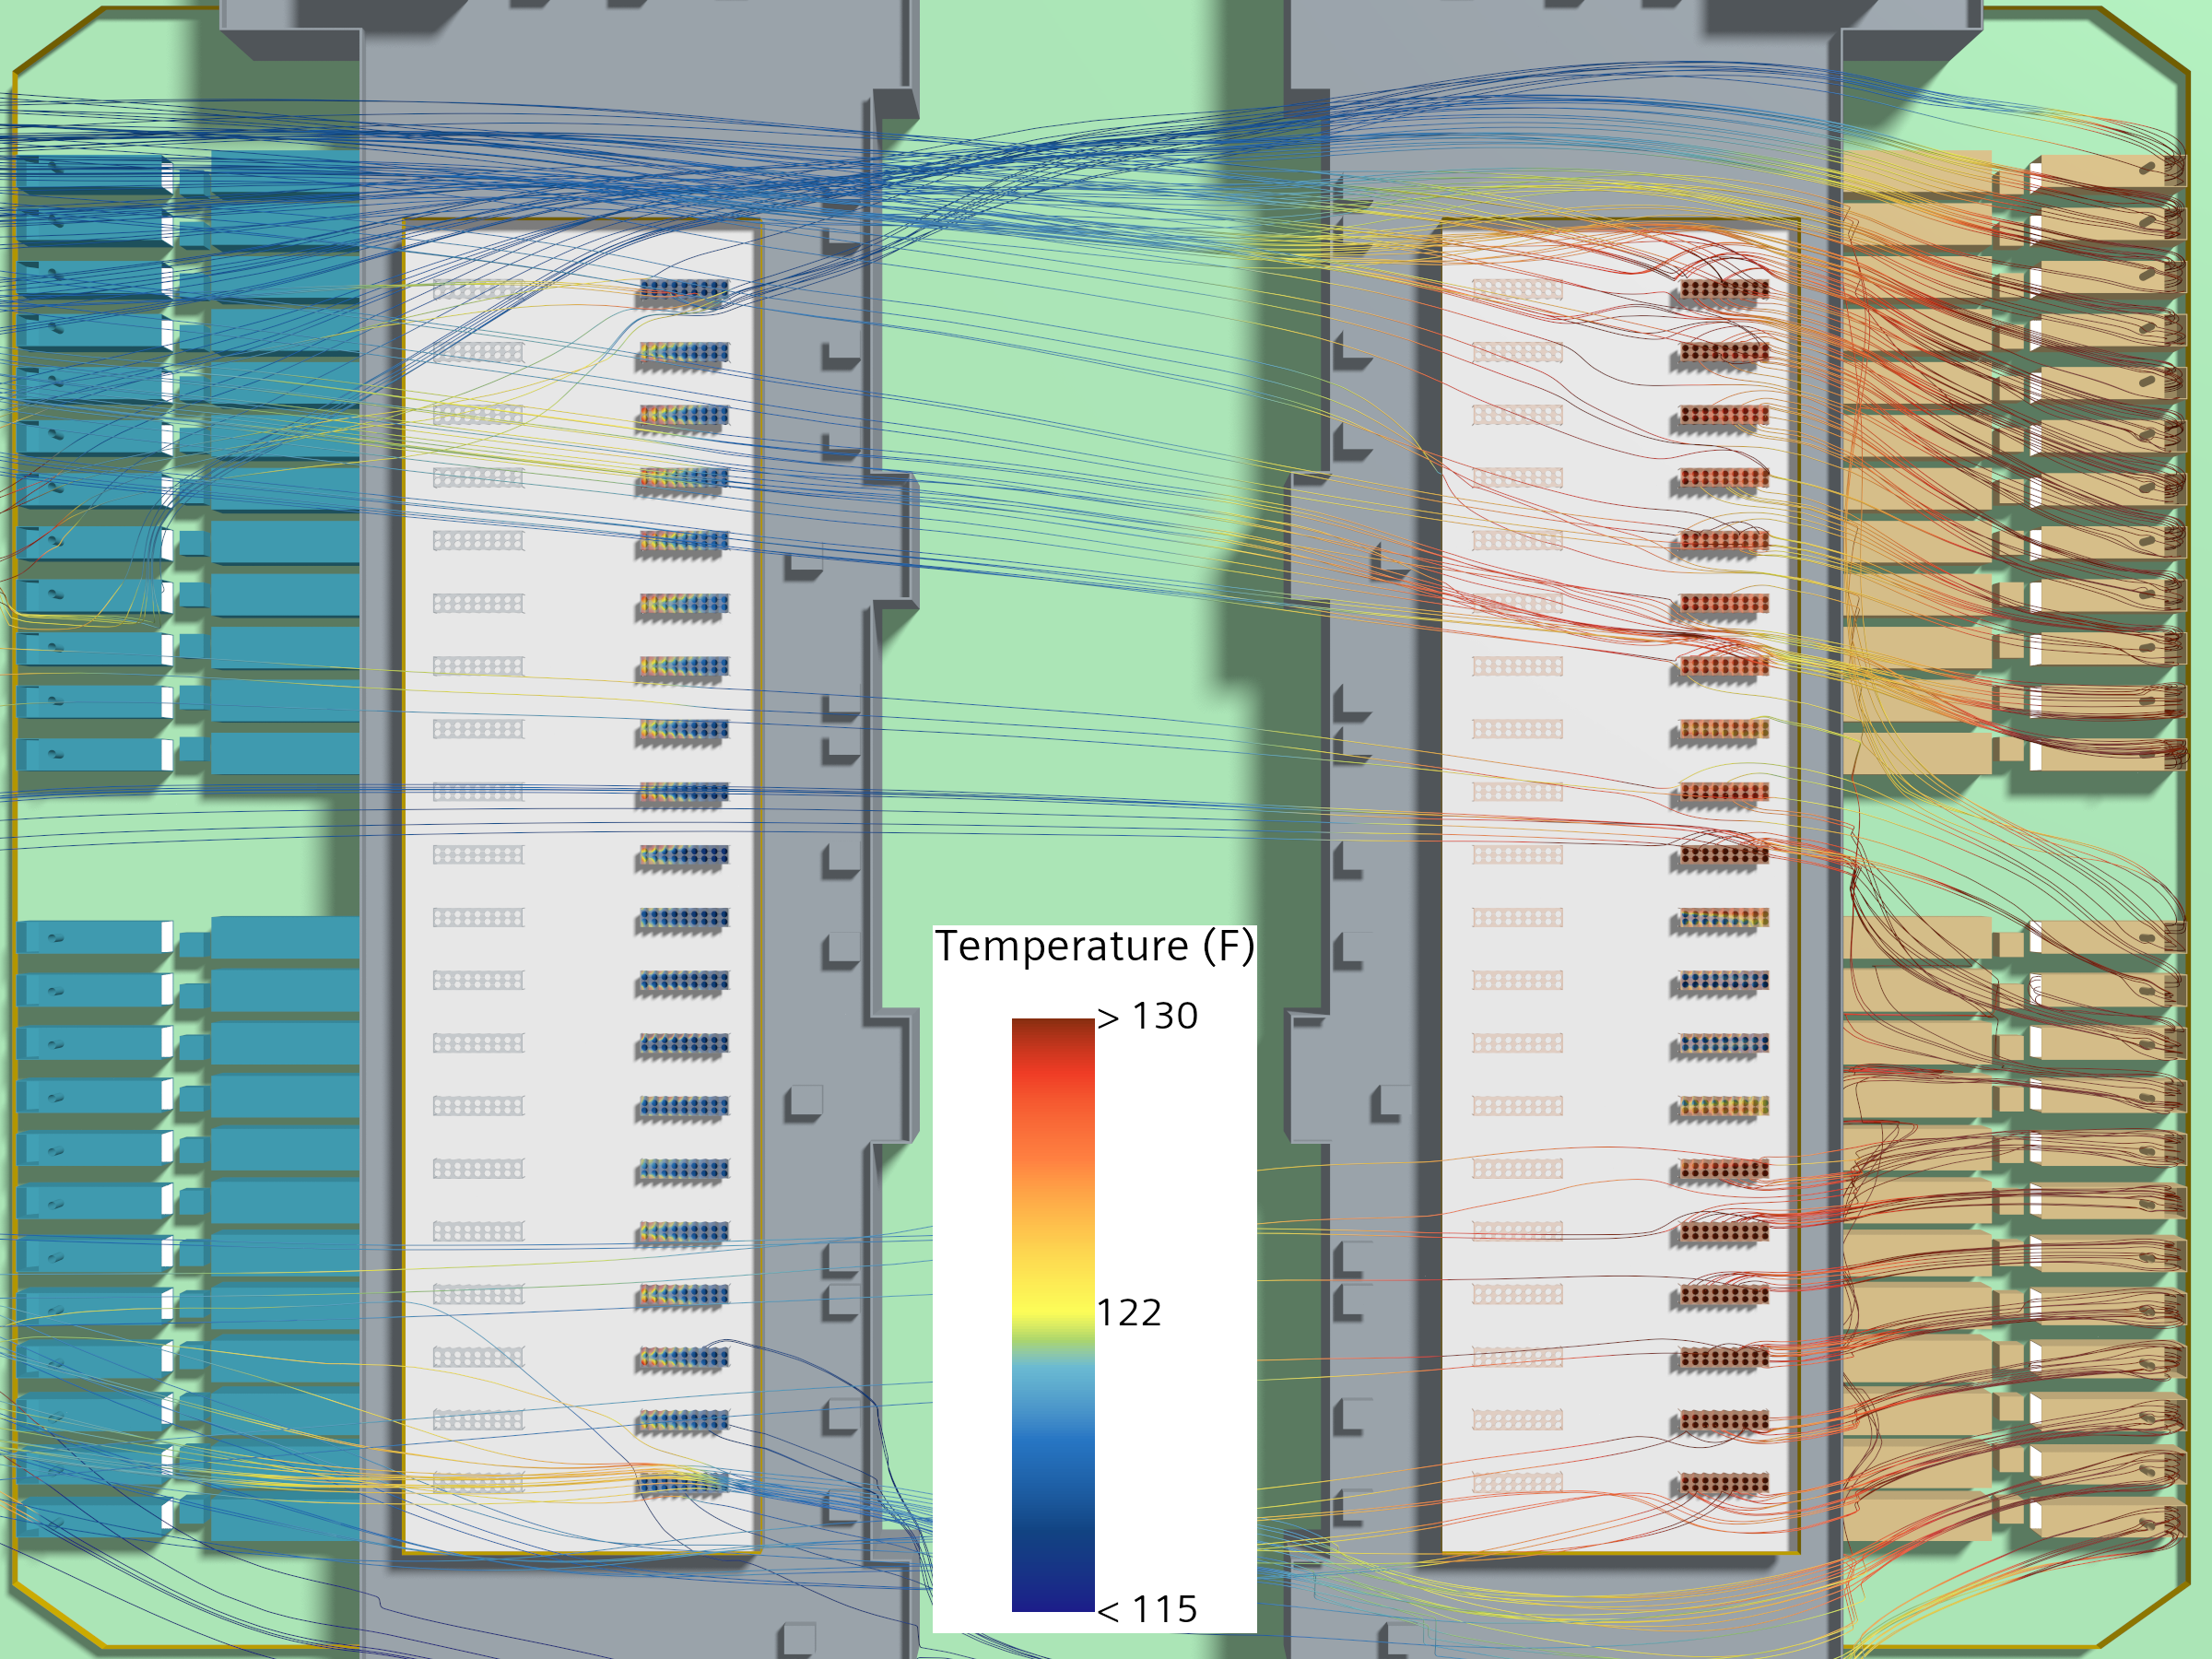
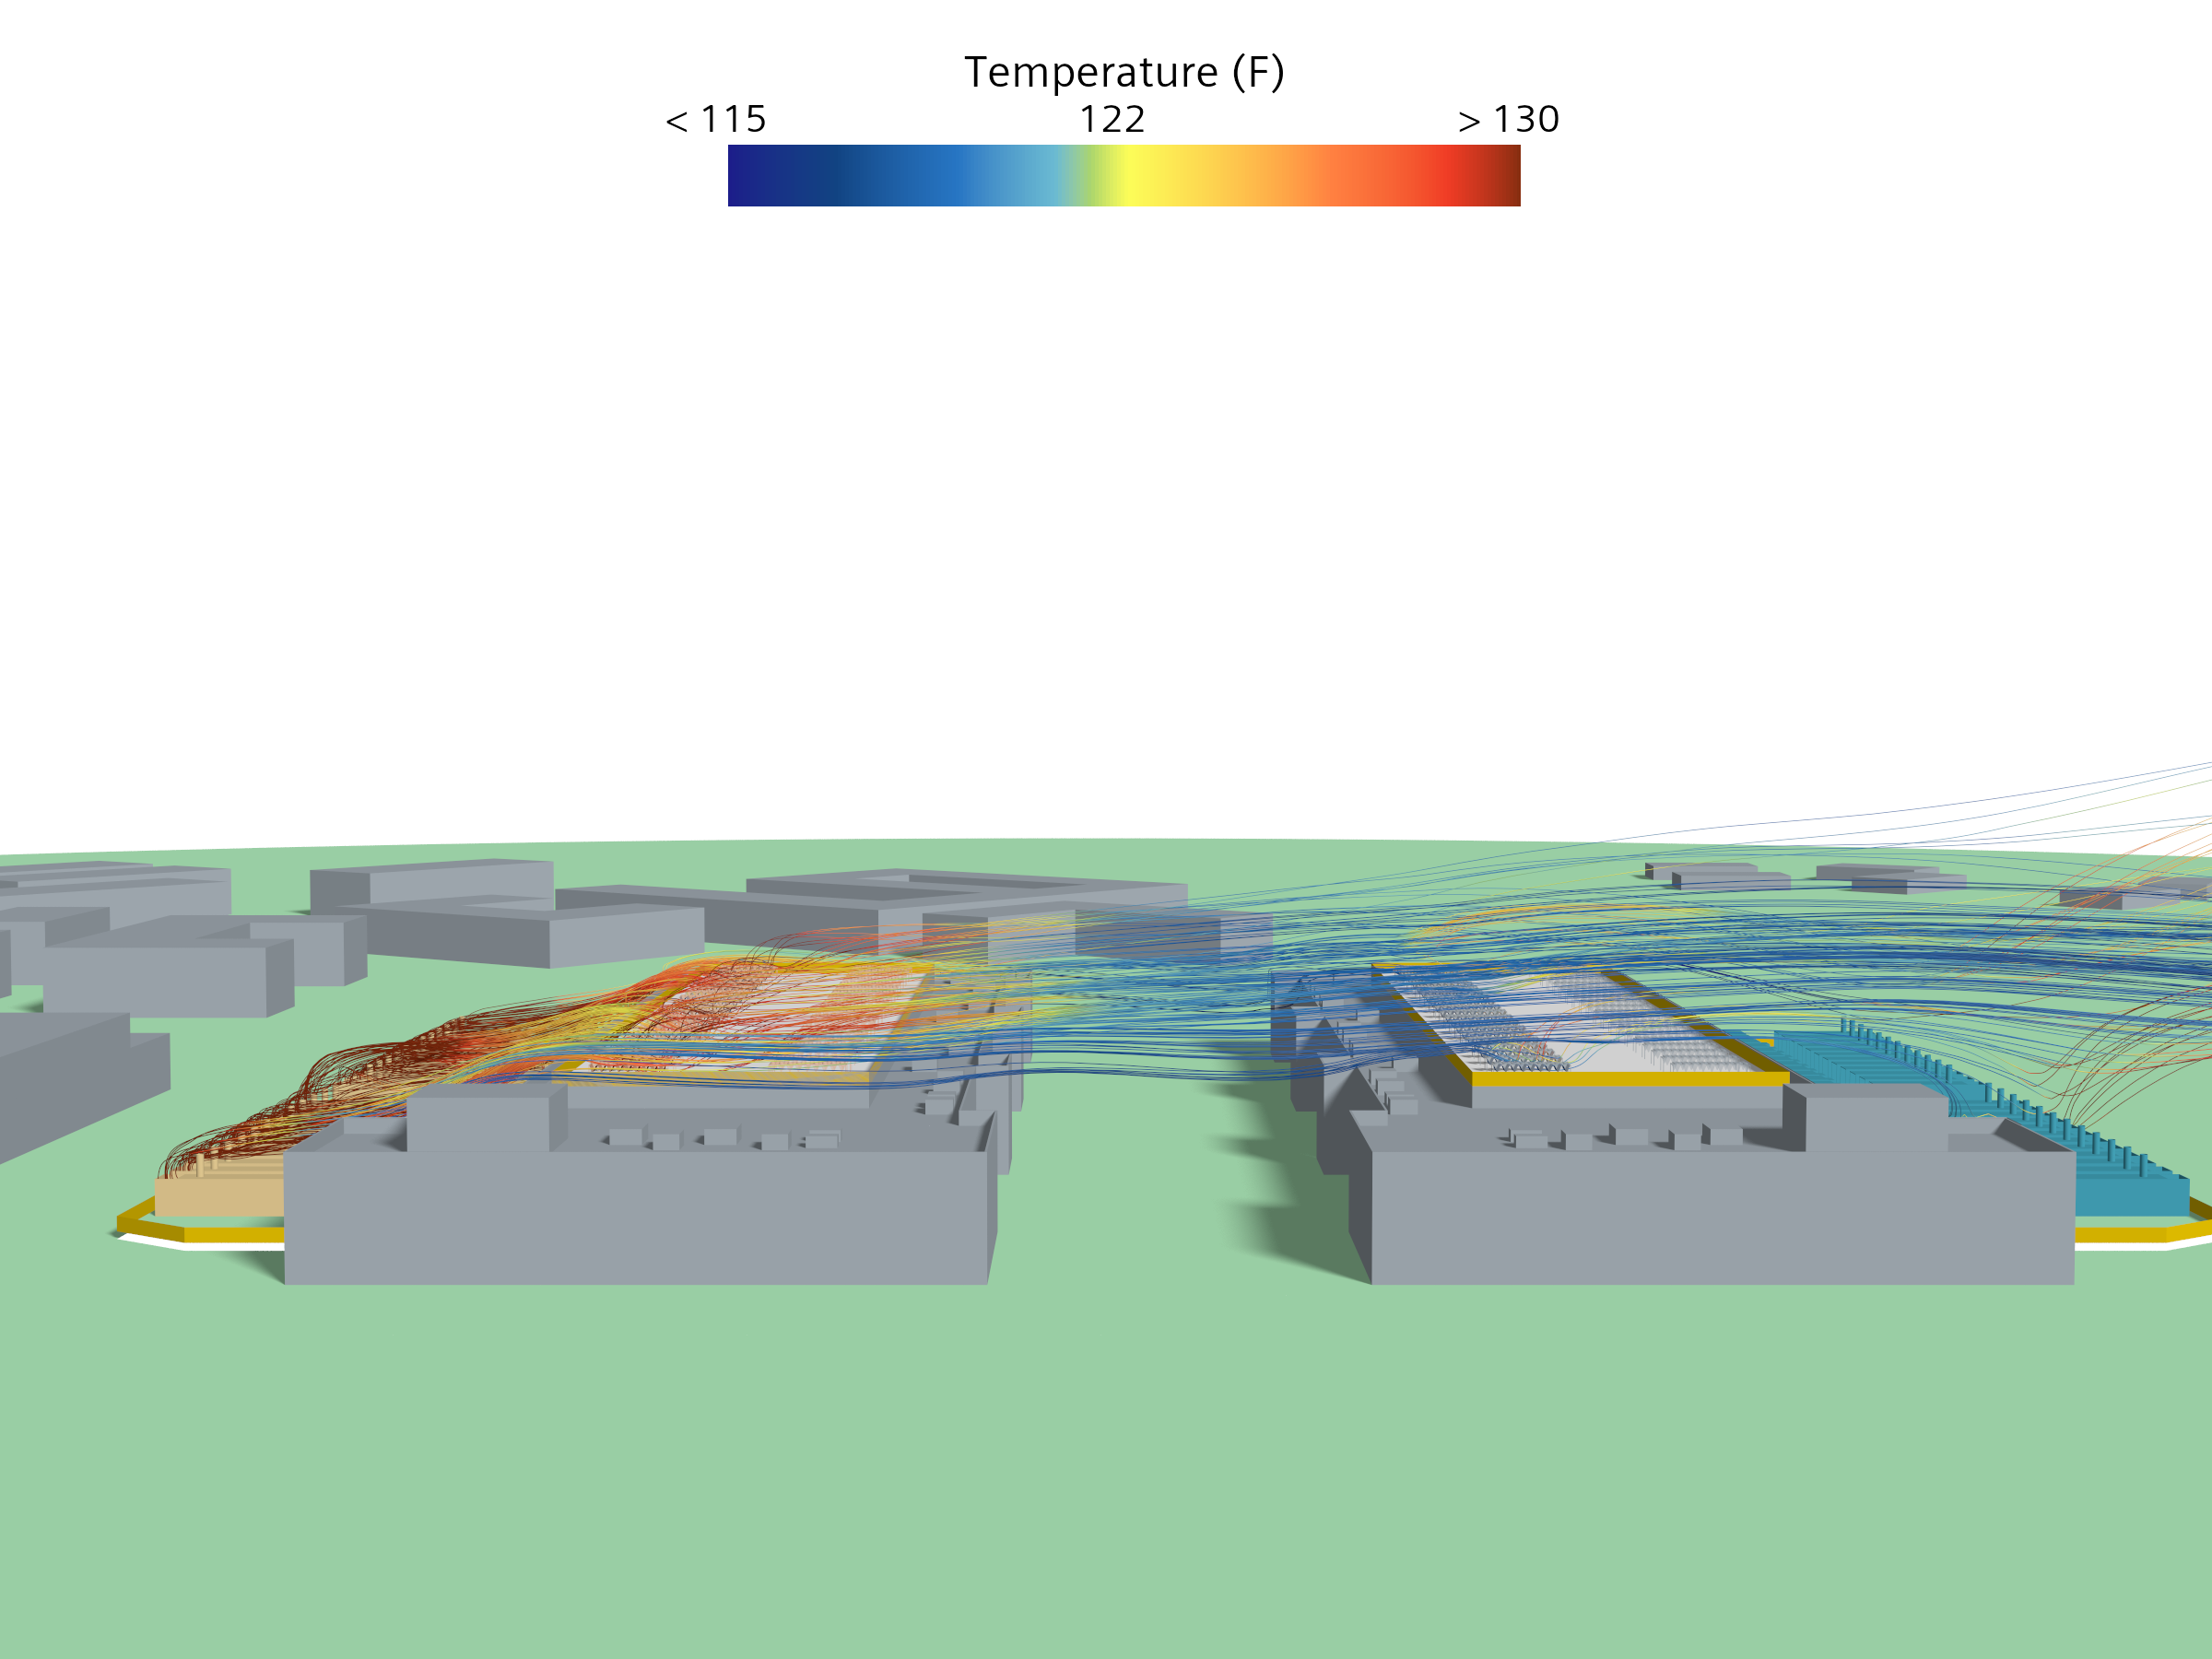
Cross-building generator exhaust under an easterly wind: three adjacent buildings share a single flow field, producing interference a single-facility model never sees. Public-source inputs. Screening-level.
What this page covers
This page presents a screening-level, campus-scale exterior CFD analysis of a three-building data center campus in the South Central United States, developed by a major colocation operator and delivered by a national A+E firm with a dedicated mission-critical practice. The buildings sit close enough to share a single exterior flow field — so the exterior thermal question is not one building's, but the campus's.
The result is a cross-building interference question. Under an easterly wind, generator exhaust and rooftop chiller discharge from the upwind buildings interact with their neighbors — the kind of exterior interaction a single-facility model, by construction, cannot see.
Facility context
The facts below are derived entirely from cited public sources: published facility and provider materials, aerial and street-level imagery, and public terrain data. No proprietary drawings, specifications, or operational data are used. Identifying details are withheld; the campus is described by type and configuration only.
- Region.
- South Central United States.
- Owner-operator.
- A major colocation operator. Not identified here.
- Architect / engineer of record.
- A national A+E firm with a dedicated mission-critical practice (full delivery: architecture, MEP, fire protection, ICT). Not identified here.
- Campus.
- Three adjacent buildings sharing one site. Building A ~36 MW (westernmost); a middle building flanked on both sides; an easternmost building ~16 MW.
- Cooling.
- Rooftop chiller arrays on the two active buildings, 2N installed; this study models N (half of installed capacity).
- Backup power.
- Diesel generator plant; gensets in the 1,750–2,500 kW class.
Scenario presented
- Wind and ambient.
- Operating scenario.
Wind from the east (90°) at 10 mph, 105°F ambient — a high-end summer design condition that drives upwind-building exhaust across the campus.
All generators running at full load, with rooftop cooling at N (half of the installed 2N capacity) on the two active buildings; the third building is included as passive geometry so its massing shapes the shared flow field.
The value of a campus-scale domain is exactly this: the buildings are modeled together, in one flow field, rather than each in isolation. A single-facility model — the industry default — cannot represent a neighbor's plume by construction.
What the model shows
The observations below are qualitative readings of the presented scenario. Quantitative outputs — per-unit intake temperatures, recirculation magnitudes — are shared with the owner's team on request.
- Generator exhaust impinges on the rooftop chillers. Under the easterly wind, exhaust reaches the rooftop chiller arrays and drives local intake temperatures toward ~125°F — the regime where shutdown setpoints engage on standard air-cooled platforms.
- The exposure is cross-building, not single-facility. A neighboring building sees comparable generator-exhaust impingement carried from upwind — a contribution that exists only because the campus is modeled as a whole.
- Other directions raise a chiller-to-chiller question. North and south winds set up inter-building discharge interference between the rooftop arrays — a second campus-scale mechanism worth screening across the compass.
- Building geometry governs the result. The three-building configuration — spacing, heights, and orientation — shapes the campus flow field, and with it the answer. It is precisely what an exterior, campus-scale model resolves and an interior or single-building model takes as fixed.
Methodology
The methodology applied here is the same standardized exterior CFD approach applied to every facility in the cohort — cylindrical far-field domain, logarithmic atmospheric boundary layer inlet, polyhedral mesh in Siemens STAR-CCM+, realizable k-ε RANS baseline — extended to a campus-scale domain that resolves all three buildings together. The presented case uses a 105°F ambient. Full domain setup, boundary conditions, solver choices, and stated limitations are documented at the Methodology page. Key terms are defined at the Key Terms and FAQ page.
Disclosure. This is independent research conducted by Resolved Analytics. All inputs are derived from cited public sources; no proprietary drawings, specifications, or operational data are used. The campus is described by type and configuration only and is not identified. Results represent idealized exterior conditions and do not represent the actual as-built performance of any facility. No claims are made regarding life-safety, code compliance, or operational performance. This material is not engineering services rendered to any party.