
16MW VA Data Center: Generator Exhaust Impingement
Rooftop plume recirculation under southwest wind. Public-source inputs. Screening-level.
What This Page Covers
This page presents a screening-level exterior CFD analysis of a 16 MW, six-vault data center located in a major northern Virginia colocation campus, designed by a national A+E firm with a dedicated mission-critical practice. The case presented here is the southwesterly wind scenario at 105°F ambient with all generators and chillers operating — the configuration in which the model produces the most pronounced rooftop plume recirculation. Additional wind cases were run but are not detailed here; results for those cases are available on request by contacting us.
Facility Context
The facts below are derived entirely from cited public sources including the operator's published facility data sheet, campus announcement records, public facility databases, and public satellite imagery. No proprietary drawings, specifications, or operational data are used.
Location: Ashburn, VA.
Owner-operator: A major northern Virginia colocation operator.
Critical IT capacity: 16 MW across six vaults.
Data floor: ~112,000 sq.ft.; two-story building; opened March 2018.
Cooling: Waterless pumped-refrigerant cooling, N+2 redundancy. Rooftop array; no cooling towers, no chilled-water loop. The CFD treats the rooftop heat-rejection units in chiller-style abstraction for the purpose of intake-temperature analysis.
Backup power: 22 diesel generators in two pods of 11 ("11 to make 10" topology, as observed in satellite imagery). Ground-level generator yard along the south building face.
Electrical service: 34.5 kV distribution, two redundant utility feeds.
Source attribution: National A+E firm with a dedicated mission-critical practice.
Wind Cases Modeled
Case presented — Southwesterly wind, design ambient, N+R.
Wind from 215° SW at 10 MPH. Ambient 105°F. All generators and chillers operating at N+R. This is the case shown in the visualizations on this page and on the downloadable poster.
Additional cases run (not presented here).
A directional sweep of additional wind conditions was modeled to identify the configuration that produces the most pronounced rooftop recirculation. Visualizations and quantitative results for those cases are not published here; they are available on request.
Observed plume behavior
The qualitative observation below is derived from the public-source model only; quantitative results — temperature distributions, re-ingestion magnitudes, recirculation values — are not published here.
Generator exhaust impinges on rooftop chillers under southwest wind. With prevailing winds from the southwest (215° at 10 MPH), ambient air at 105°F, and all generators and chillers operating at N+R, the model produces flow patterns that carry the ground-level generator exhaust column upward and onto the rooftop chiller array. Local intake temperatures across the central portion of the array climb toward and above 125°F — the regime where shutdown setpoints engage on standard air-cooled chiller platforms. The number of affected units and the spatial extent of the recirculation depend on the as-built generator-yard layout and rooftop chiller spacing, which would benefit from confirmation against the as-built drawings.
Methodology
The methodology applied to this facility is the same standardized exterior CFD approach applied to every facility in the cohort — cylindrical far-field domain, logarithmic atmospheric boundary layer inlet, polyhedral mesh in Siemens STAR-CCM+, realizable k-ε RANS baseline. Full domain setup, boundary conditions, solver choices, and stated limitations are documented at the Methodology page. Key terms used here are defined at the Key Terms and FAQ.
For the Engineer of Record
The full per-facility figure set (visualizations for the case presented here plus the additional wind cases run during this study, plume isosurface plots, and rooftop surface temperature maps) and a one-paragraph quantitative summary are available on request. If additional wind conditions are of interest, those can be run as well. We share results directly with the named engineer of record, not with building owners, operators, or other parties. Contact stewart@resolvedanalytics.com and reference this Ashburn, VA facility.
About the Author
Stewart Bible, Principal, Resolved Analytics. Resolved Analytics is a Computational Fluid Dynamics consulting practice and authorized Siemens STAR-CCM+ reseller, with a long-standing service line in mission-critical facility exterior analysis. Contact: stewart@resolvedanalytics.com.
Disclosure
This is independent research conducted by Resolved Analytics without engagement, sponsorship, or input from the building owner, operator, or engineer of record. All inputs are derived from cited public sources; no proprietary drawings, specifications, or operational data are used. Results represent idealized exterior conditions and do not represent the actual as-built performance of any facility. No claims are made regarding life-safety, code compliance, or operational performance. All firm and project references have been anonymized. This material is not engineering services rendered to any party.
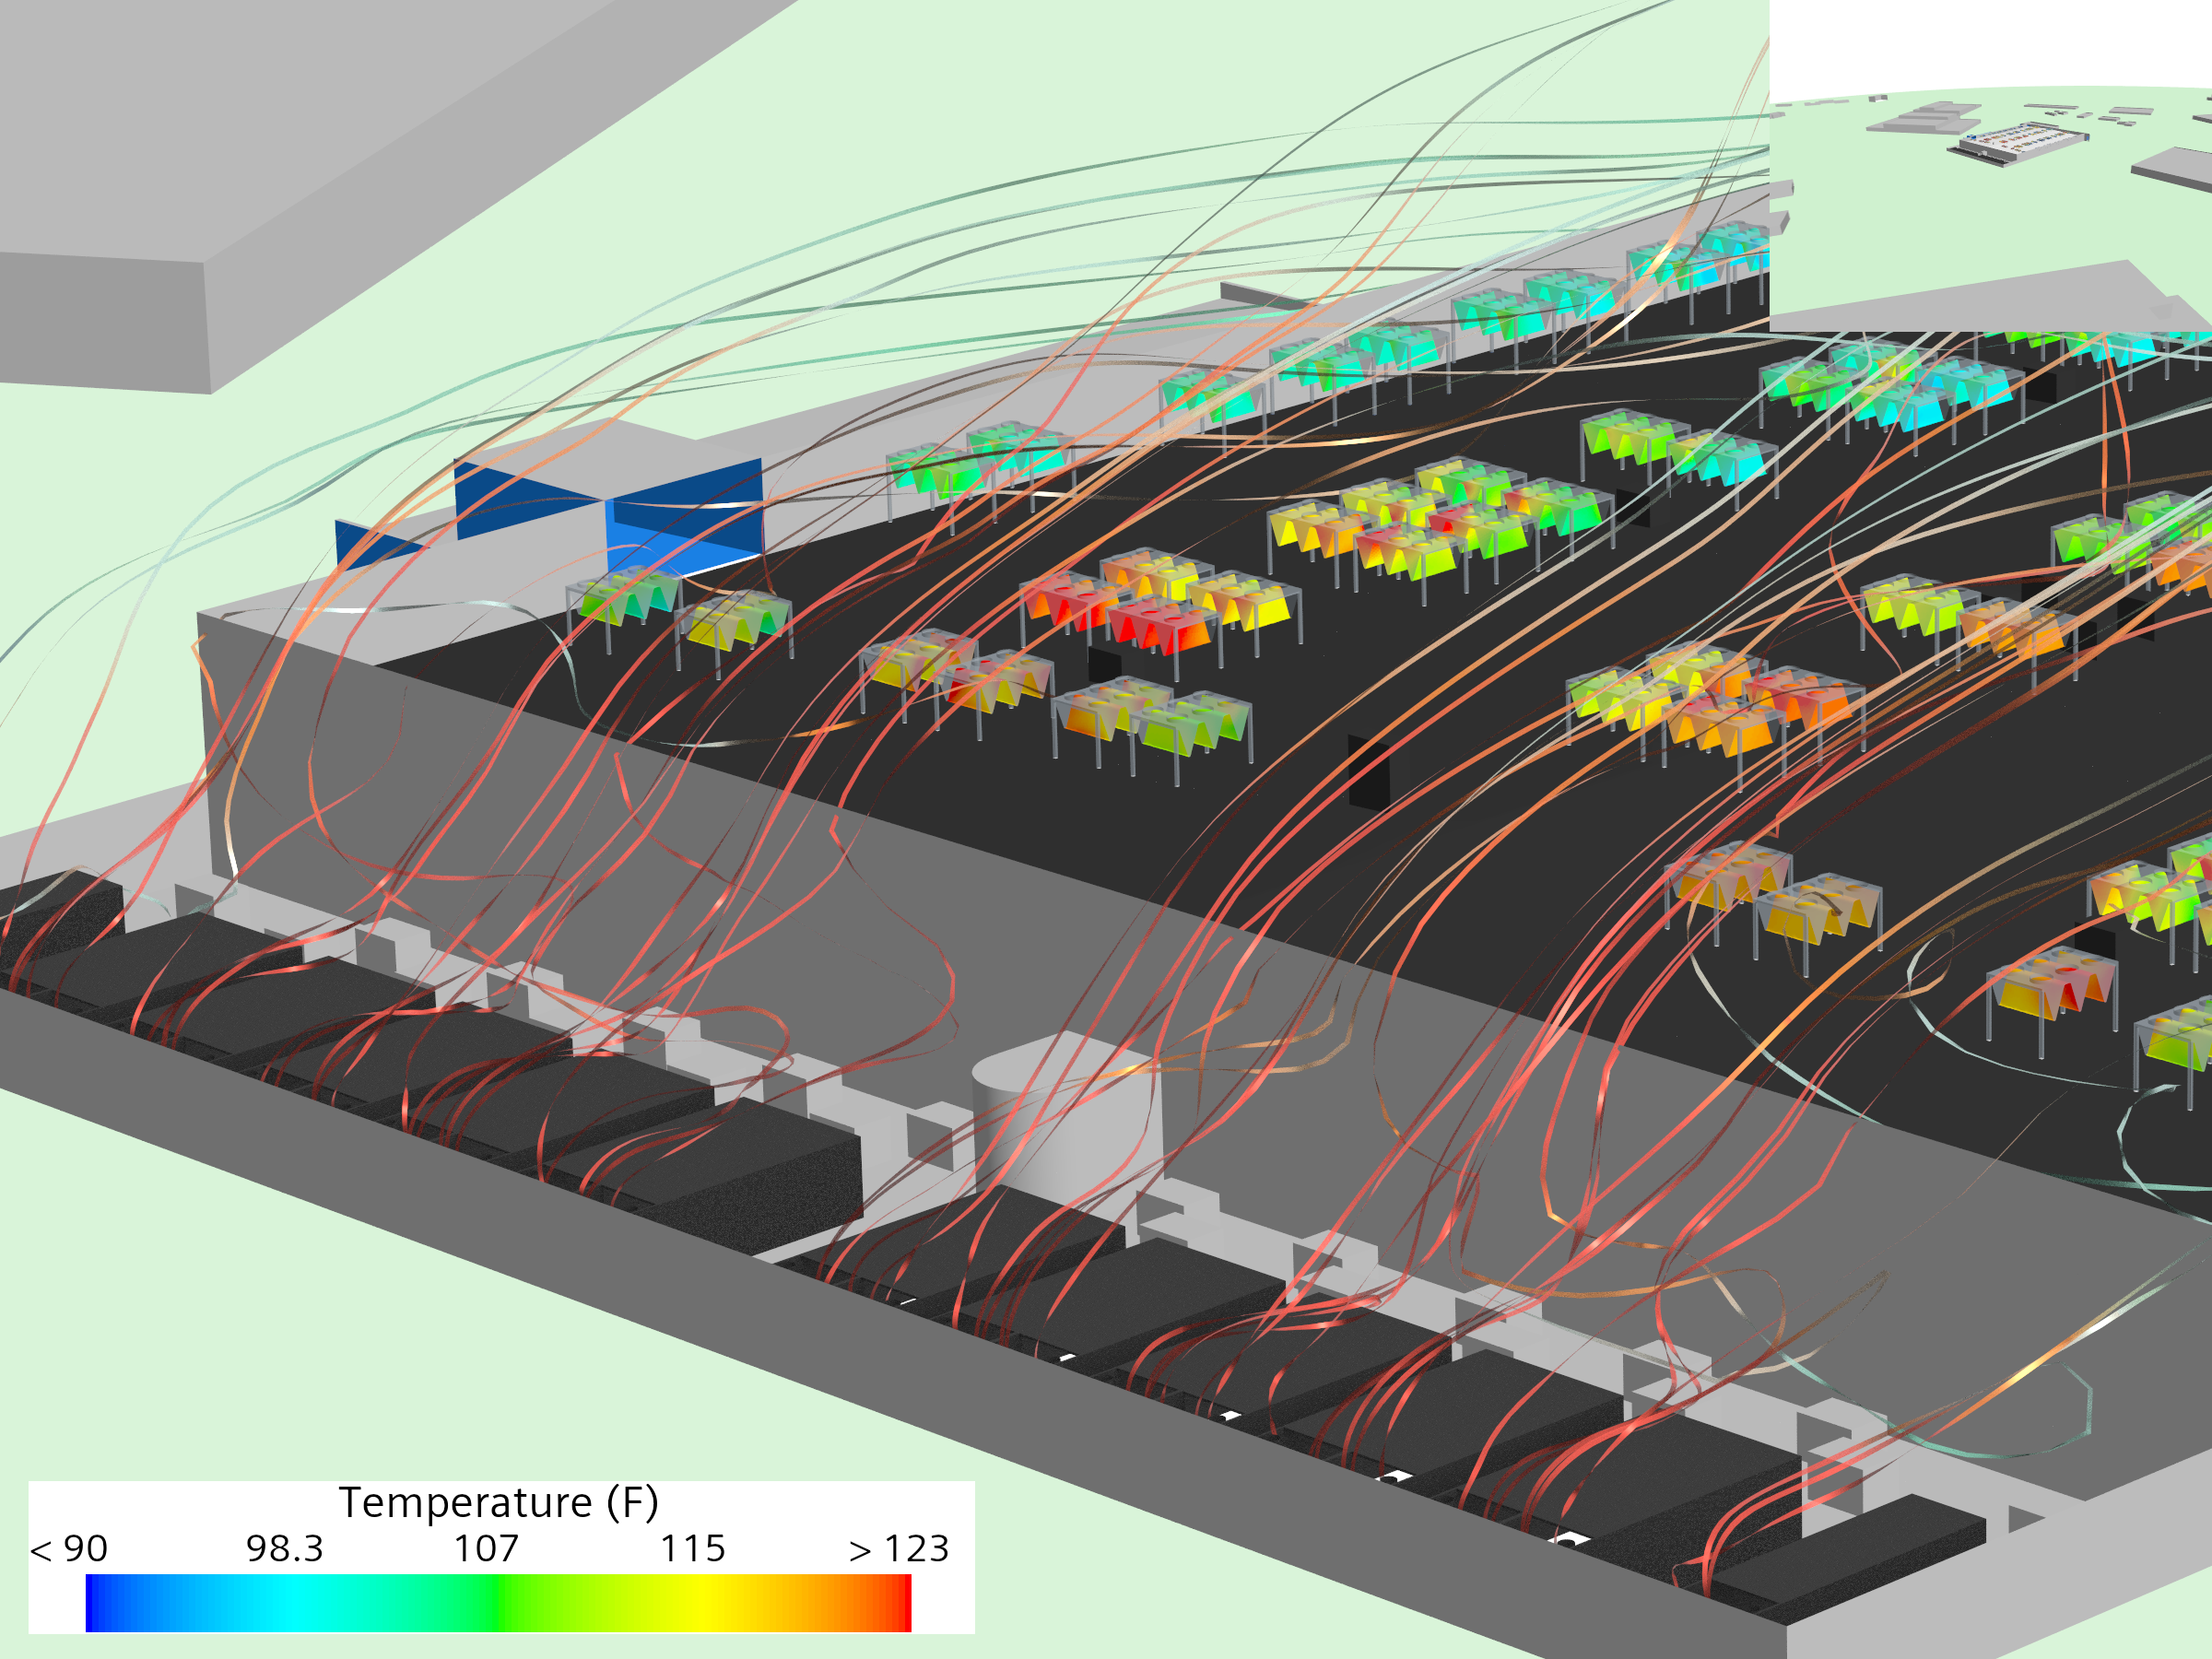
CFD result: rooftop chiller intake temperatures with streamlines overlaid. Wind from 215° SW at 10 MPH, 105°F ambient, with all generators and chillers operating at N+R. Streamlines reveal flow patterns that carry generator exhaust onto the rooftop chiller array; per-unit intake temperatures climb toward and above the 125°F shutdown threshold across the central portion of the array.
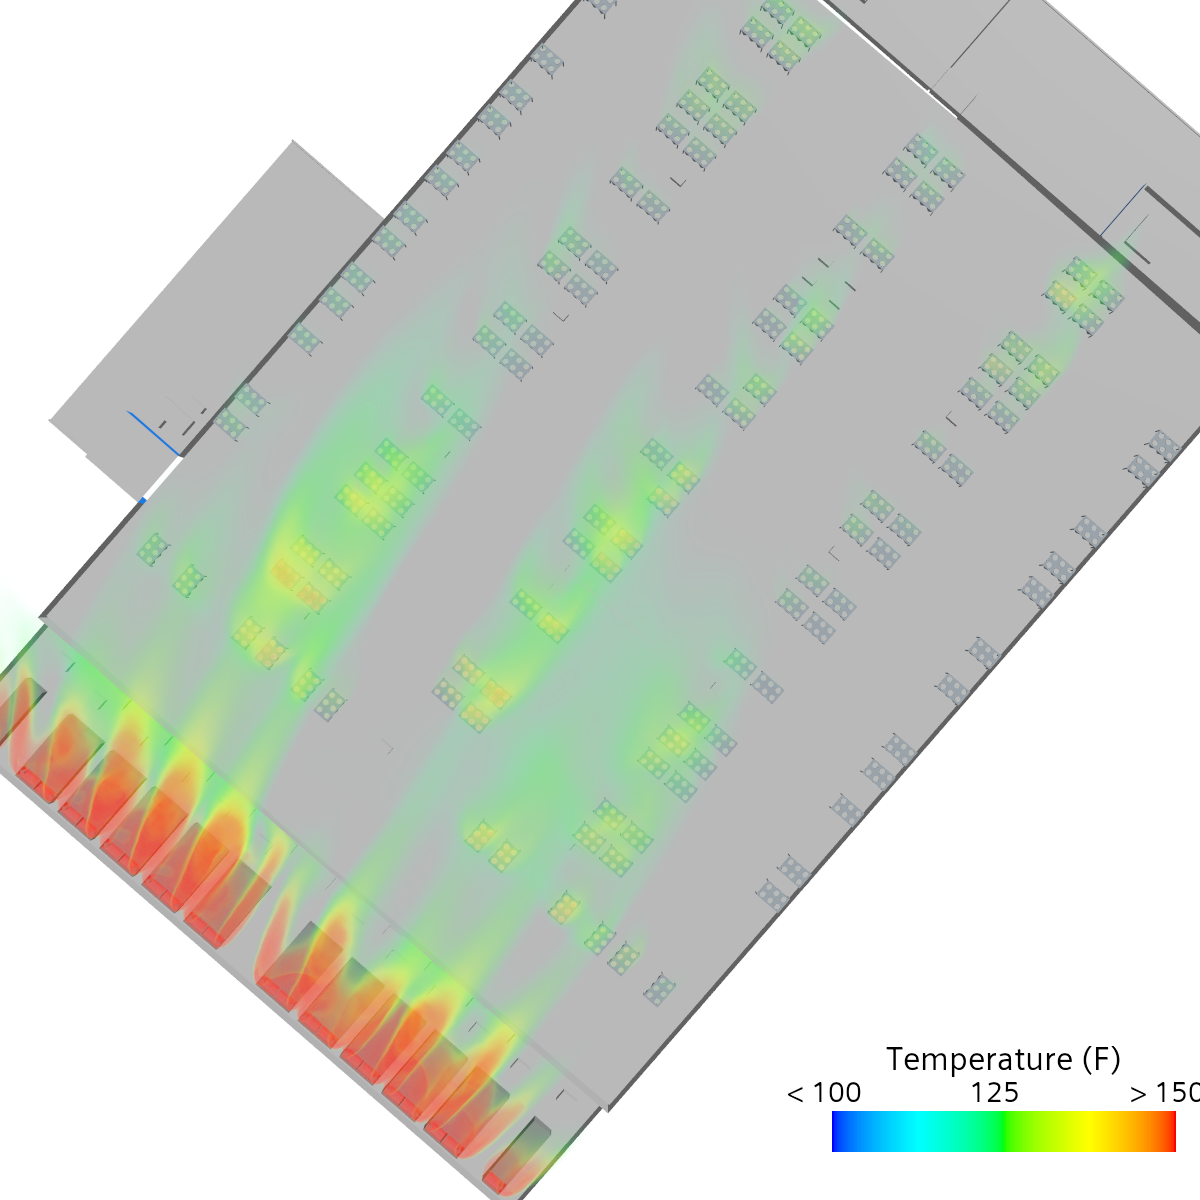
Plan view. Top-down view of the rooftop chiller array under the southwest wind case. Surface coloring shows local air temperature; the band of elevated temperature traces the path of generator exhaust drifting across the roof from the ground-level yard at the lower edge of the frame.
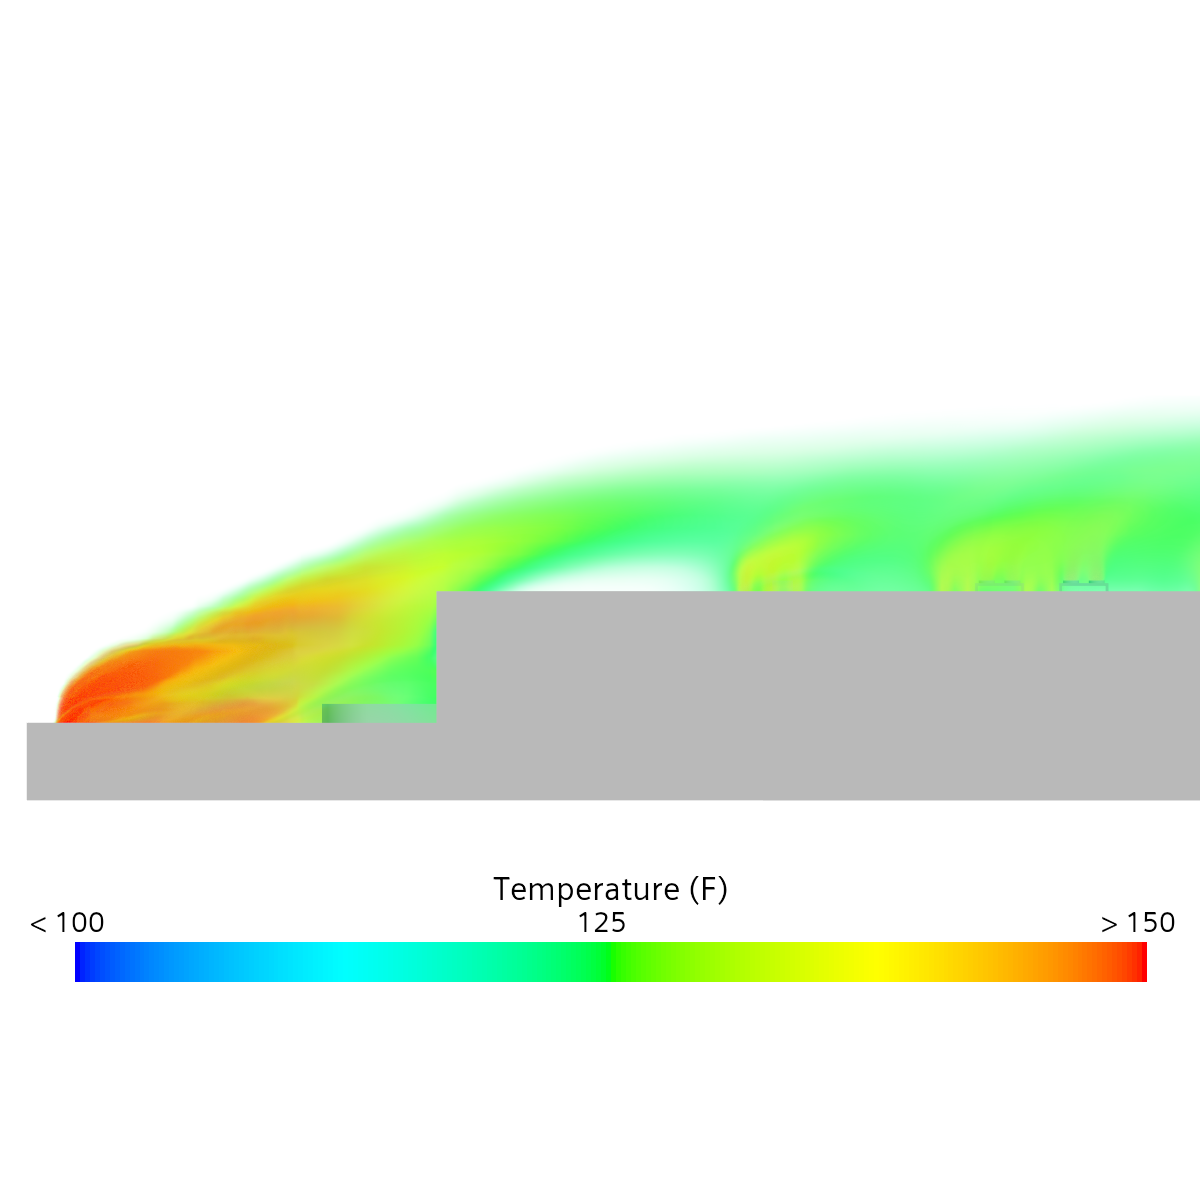
Elevation view. Side elevation of the same wind case. The generator exhaust column rises off the ground-level yard at the left and tilts downwind across the building face, with elevated air temperatures (yellow/red) carrying up onto the rooftop above the chiller array.