
Systems Modeling
See what happens to your liquid cooling and chilled-water systems when the power goes out, before it does.
Systems modeling in brief
Resolved Analytics builds transient system models of data center cooling in Simcenter Amesim, for MEP engineering firms and facility owners. Our core study is a loss-of-utility and restart analysis: pumps stop, chillers restart on their sequence, thermal storage responds, and we report coolant temperatures at every CDU, fan wall unit, FCU, and liquid-cooled cabinet against your limits. Most studies take about a week once we have your data.
Why model the whole system
A power loss plays out over minutes. Primary pumps stop, chillers drop offline and restart on a sequence, and warm water works its way through headers, rings, and CDUs to the IT load. Whether cabinets stay within their limits depends on how all of those pieces interact over time, and a steady-state design calculation can't show that.
A 1D system model can. It uses validated component models instead of a 3D mesh, so a full plant and hall can be run through an outage and recovery in minutes. That makes it practical to test restart sequences, thermal storage sizing, and control setpoints while they're still on paper.
What We Model
Liquid cooling loops
Do cabinet temperatures stay within limits if the primary side is lost?
CDUs, fan walls, and FCUs
What supply temperature does each unit see?
Chilled-water networks
Do flows and pressures match the design?
Thermal energy storage
How long does stored cold water carry the load?
Chillers and restarts
How do restart timings shape the temperature peak?
Expansion tanks
How much does system pressure rise during an event?
Failure and recovery
How does the system ride through a power loss, pump trip, or chiller failure?
Economizers and towers
When should the plant switch between modes?
Annual energy and PUE
What will the plant use over a year at your site?
Other thermal-fluid systems
The same approach works for process cooling loops, HVAC systems, industrial heat exchangers and fluid networks, and equipment thermal management. Talk to an engineer about your system.
Cooling and power together
The same model can include the electrical side: UPS, battery storage, on-site solar, generators or gas turbines, and the grid connection. That lets cooling and power be studied together, for example how the plant rides through a utility outage and generator start.
Detail where it matters
We model the part of the system your question is about in full detail, pipe by pipe, and represent the rest with simpler equivalent loops. In a liquid cooling study, for example, the secondary loop from CDUs to cabinets is modeled pipe by pipe, while the chiller plant is a single representative loop. Each component is modeled at the level the question needs, from a simple performance curve to a detailed physical model. That keeps the model fast and the answer focused, without losing the physics that drive the result.
System and space, in one study
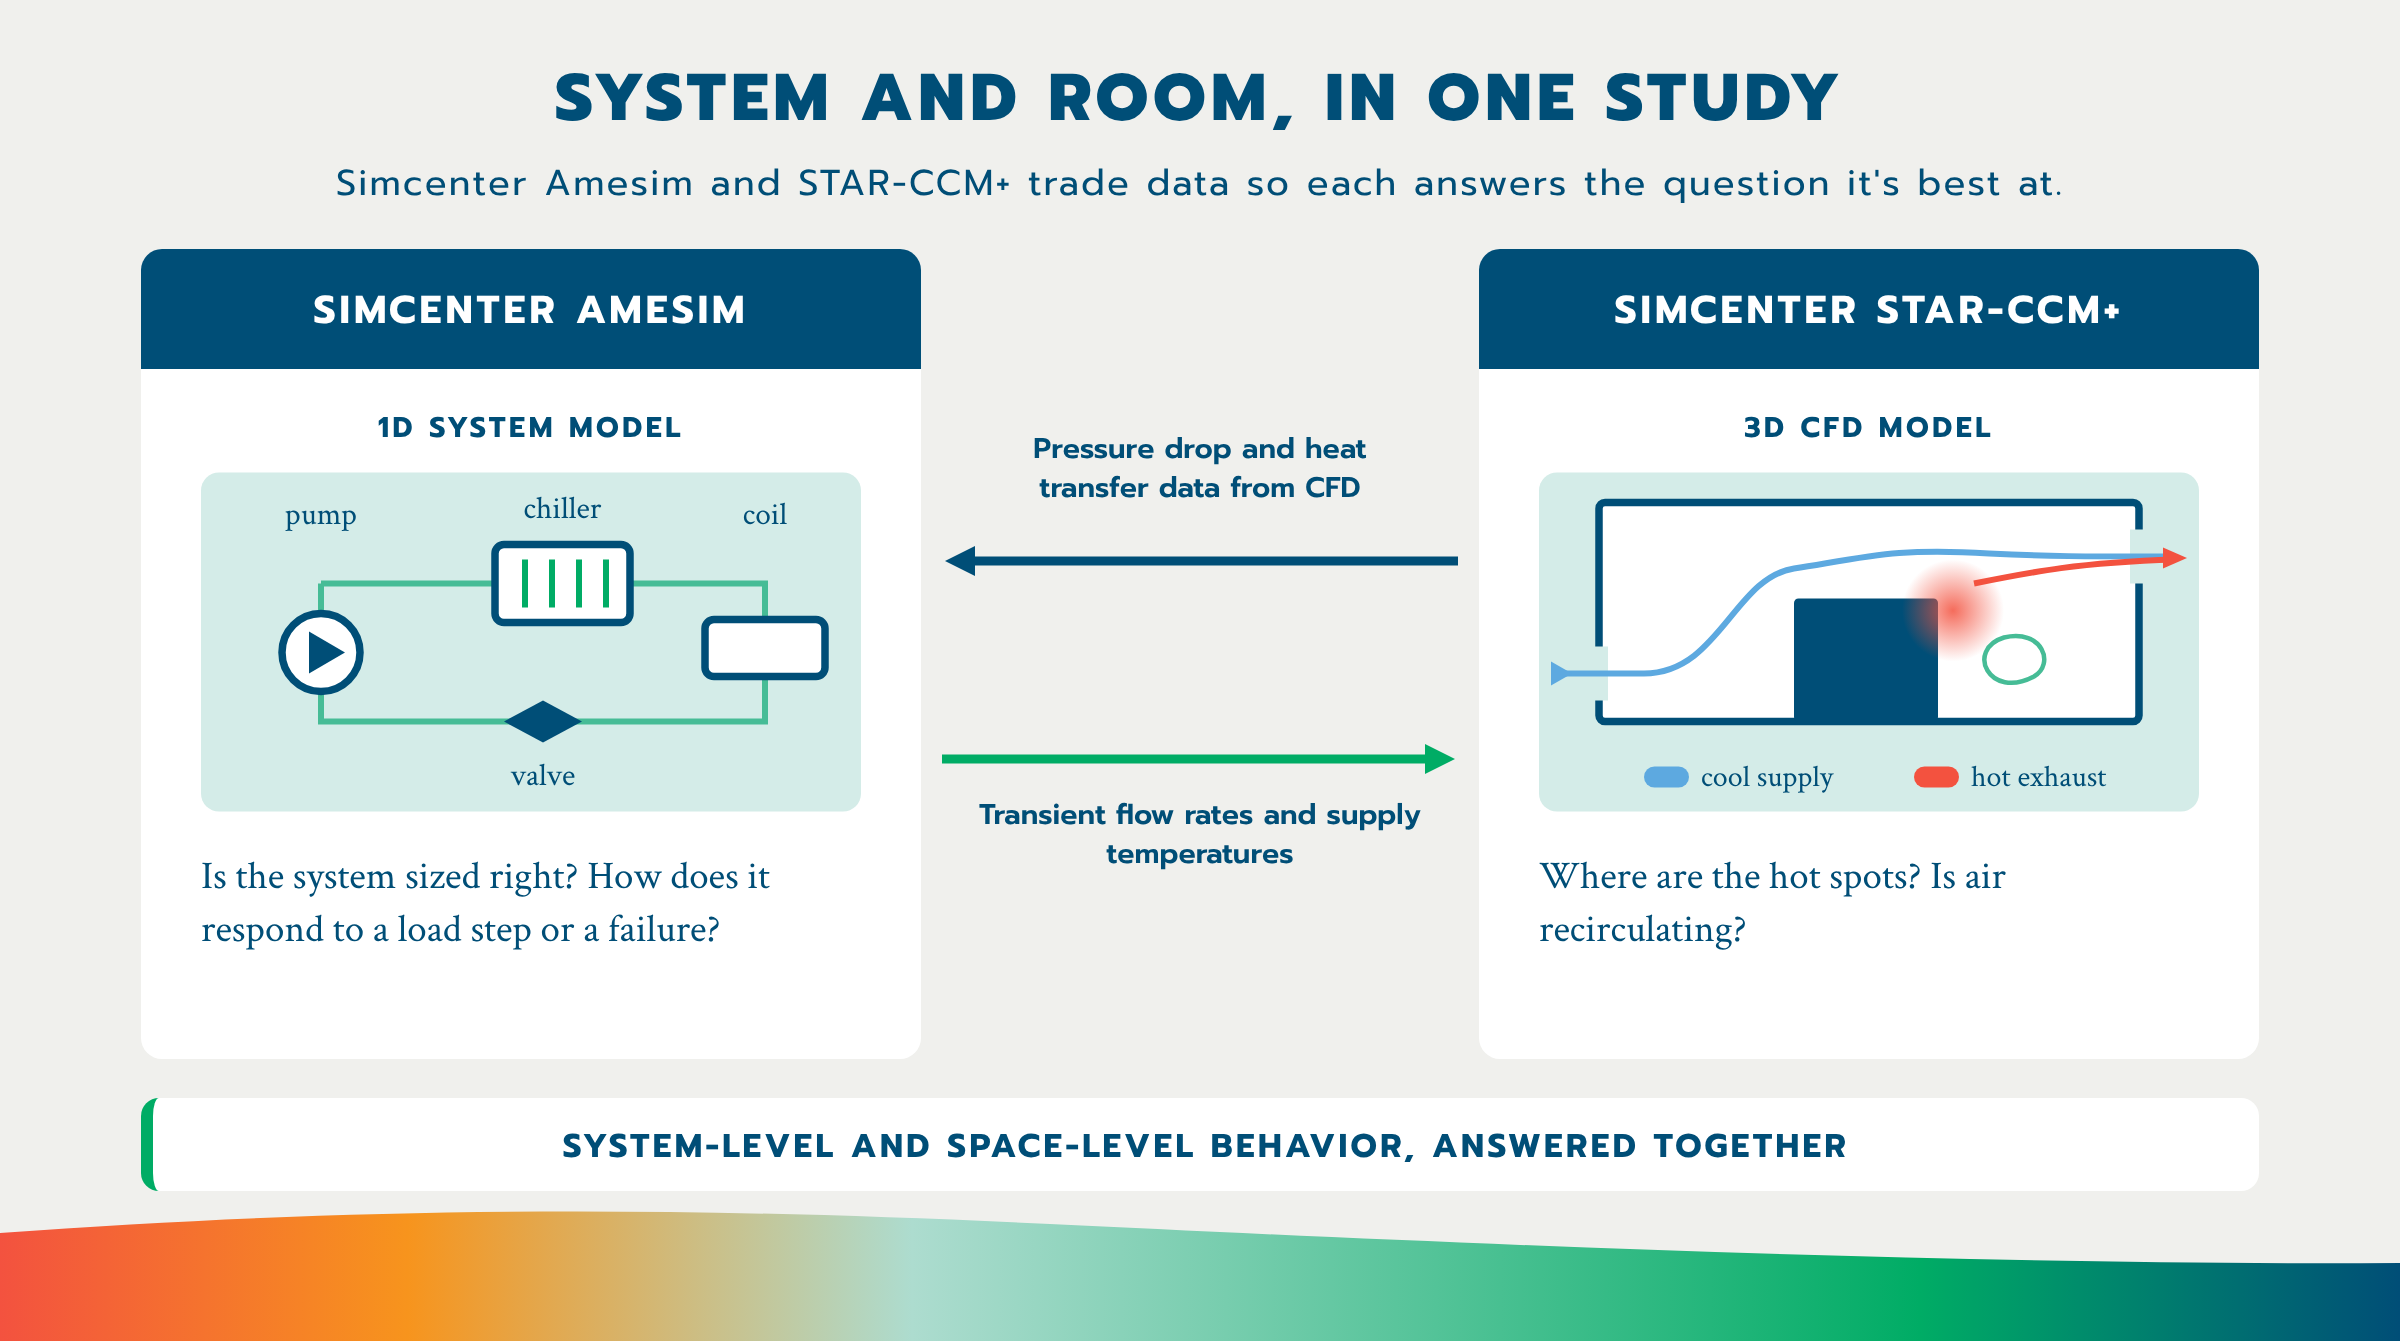
When a question spans both the plant and the room, we pair a system model with 3D CFD. CFD supplies pressure-drop and heat-transfer characteristics to the system model, and the system model sends transient flow rates and supply temperatures back to CFD. Together they show how a plant event shows up as temperatures at the racks. We can also characterize a component such as a cold plate or rack in 3D CFD and bring it into the system model as a fast reduced-order block, so a transient that would take days in CFD runs in minutes.
We link the two models in one of two ways, depending on the question. For most studies, CFD results are passed to the system model as tables. When the plant and the room affect each other strongly through an event, we run both together in co-simulation, so each updates the other as the event plays out.
Built from your design
Built from your design
Your hydraulic model as the starting point. We build the network from your PIPE-FLO model or piping drawings, with your pipe sizes, lengths, and design flows.
Your equipment. Chillers, CDUs, and heat exchangers are represented from manufacturer data and your unit duties and flows.
Your controls. TES valve logic, chiller setpoint control, and pump and chiller restart schedules come from your sequence of operations.
Your fluids. Water or glycol mixes, with temperature-dependent properties.
Existing plants. For an operating facility, we can tune the model to match trend data, so it reflects how the plant actually runs.
Liquid cooling ride-through, high-density AI data hall
For an MEP engineering firm, we modeled the secondary liquid cooling loop serving about 100 liquid-cooled cabinets in pipe-by-pipe detail, with the chiller plant represented as a single loop. We simulated a loss of utility and restart, and showed that cabinet inlet temperatures stayed within the client's limits throughout the event.
Recent Projects
Chilled-water plant outage study.
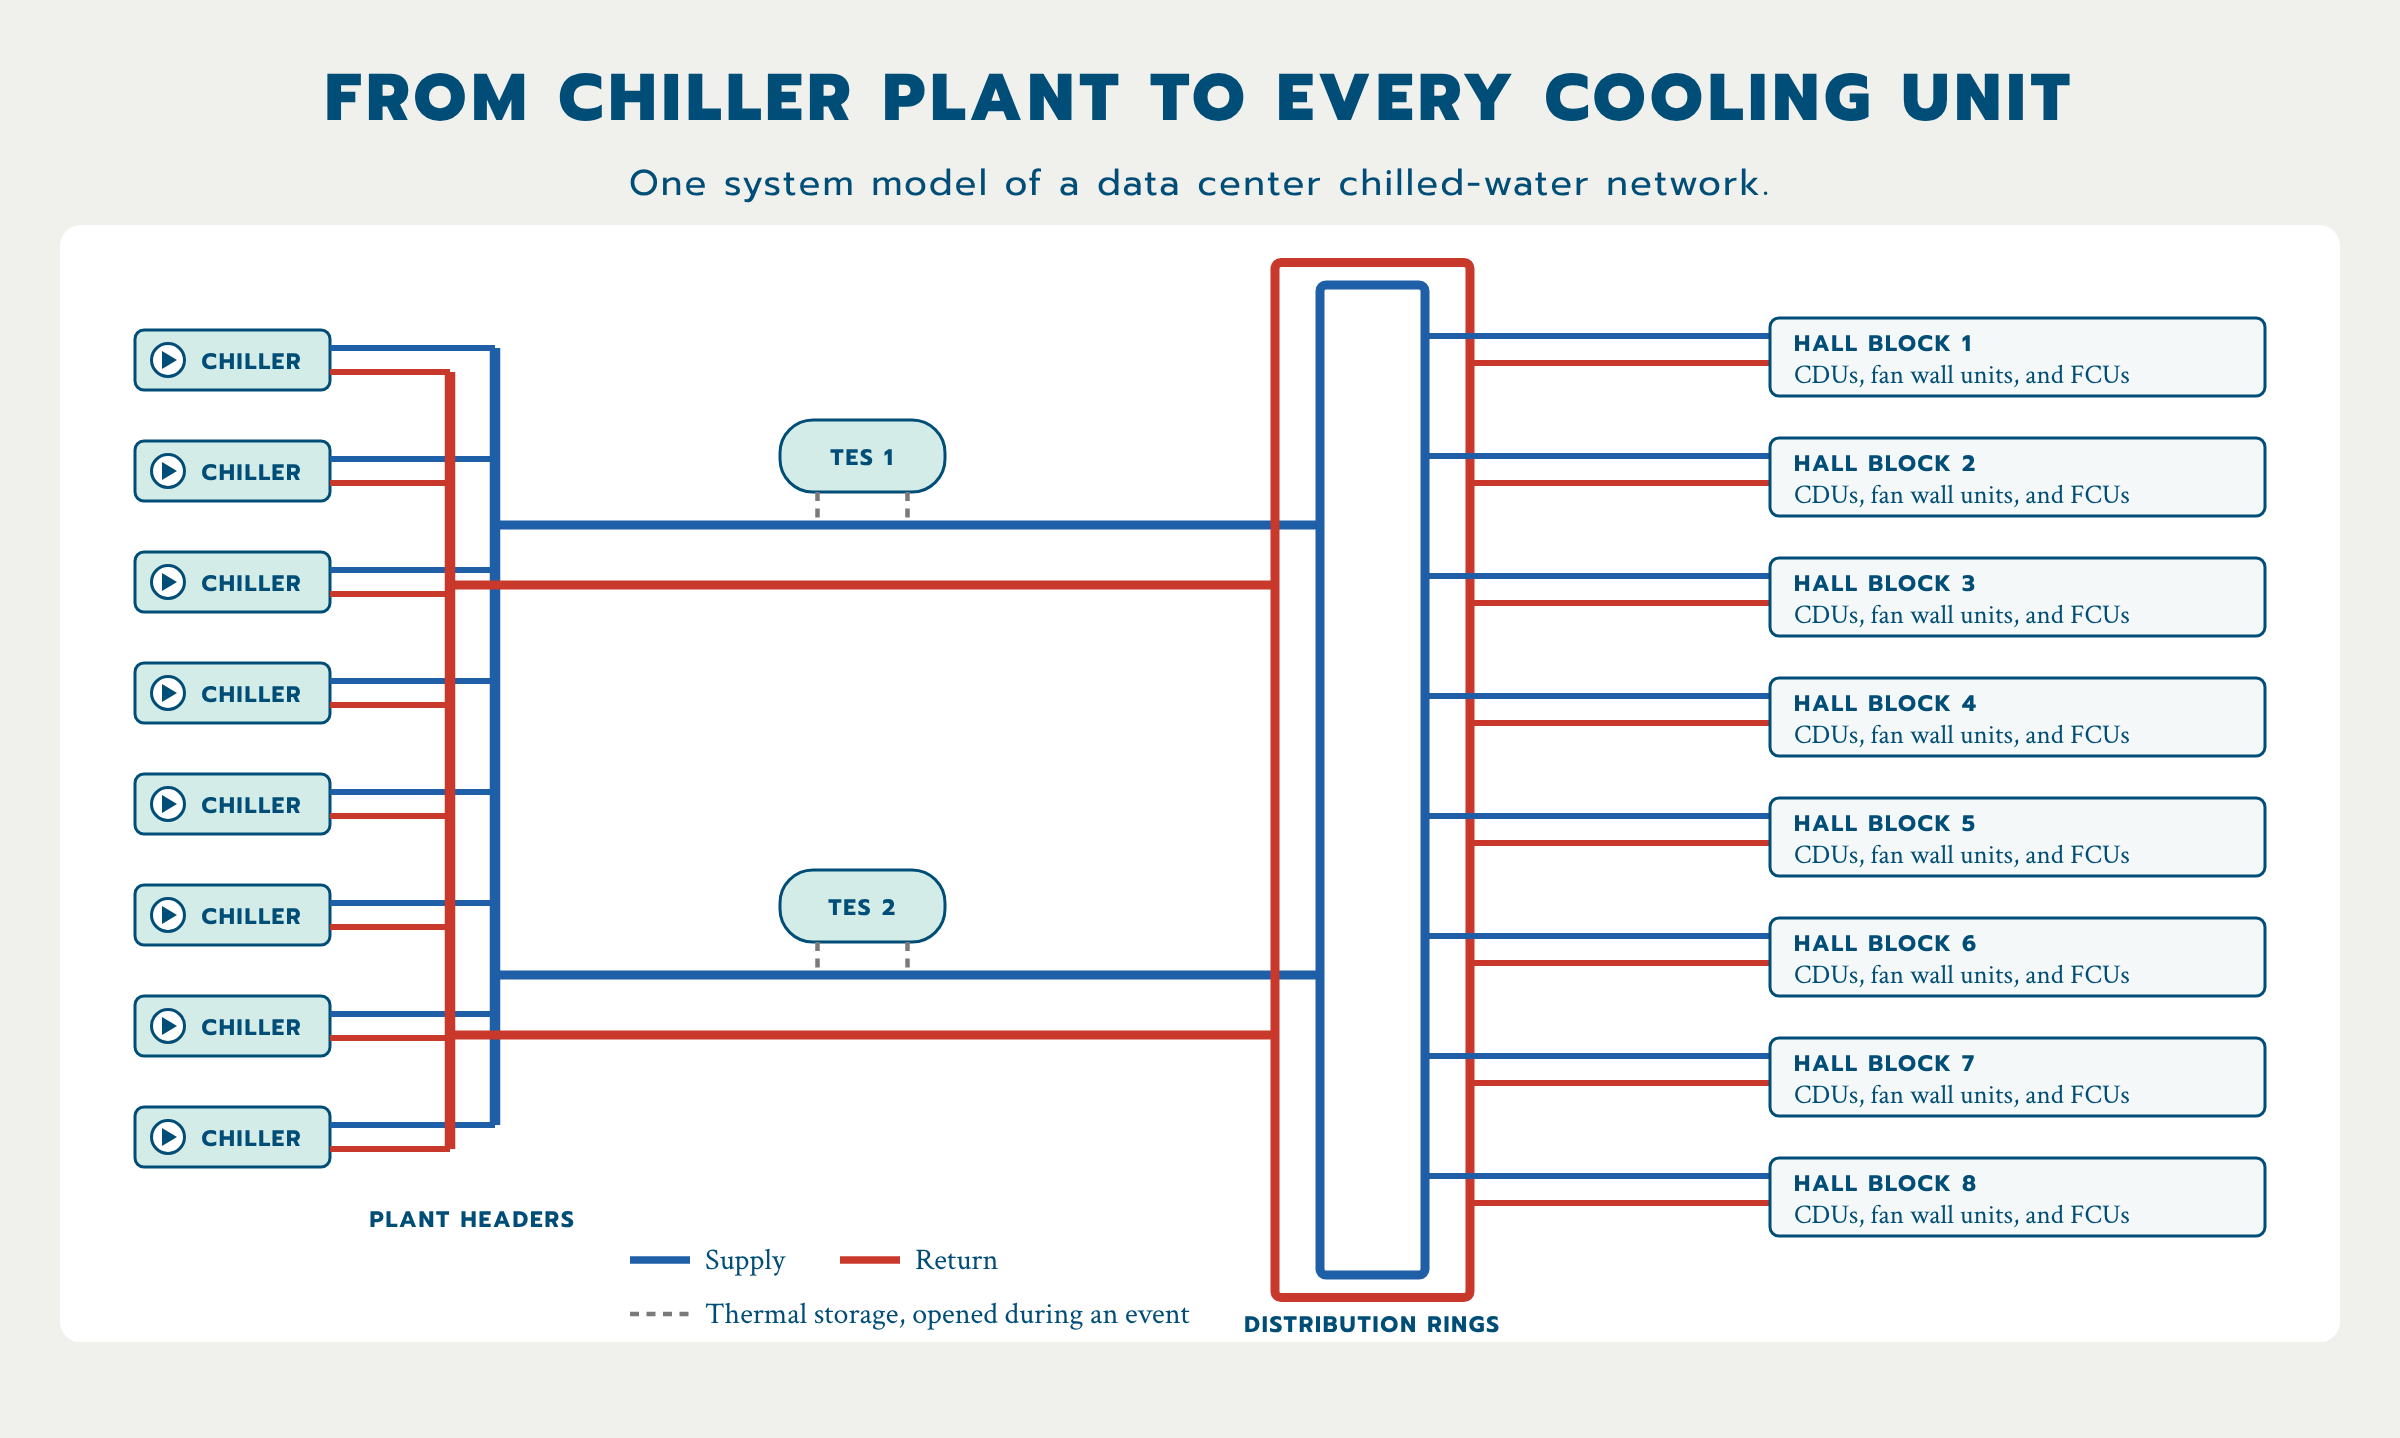
For an MEP engineering firm, we modeled a large chilled-water plant from its chillers and thermal storage through the distribution rings to every cooling unit in the hall, built from the firm's PIPE-FLO model. The study tracks supply temperature at each unit, thermal storage response, and system pressure through a power loss and restart.
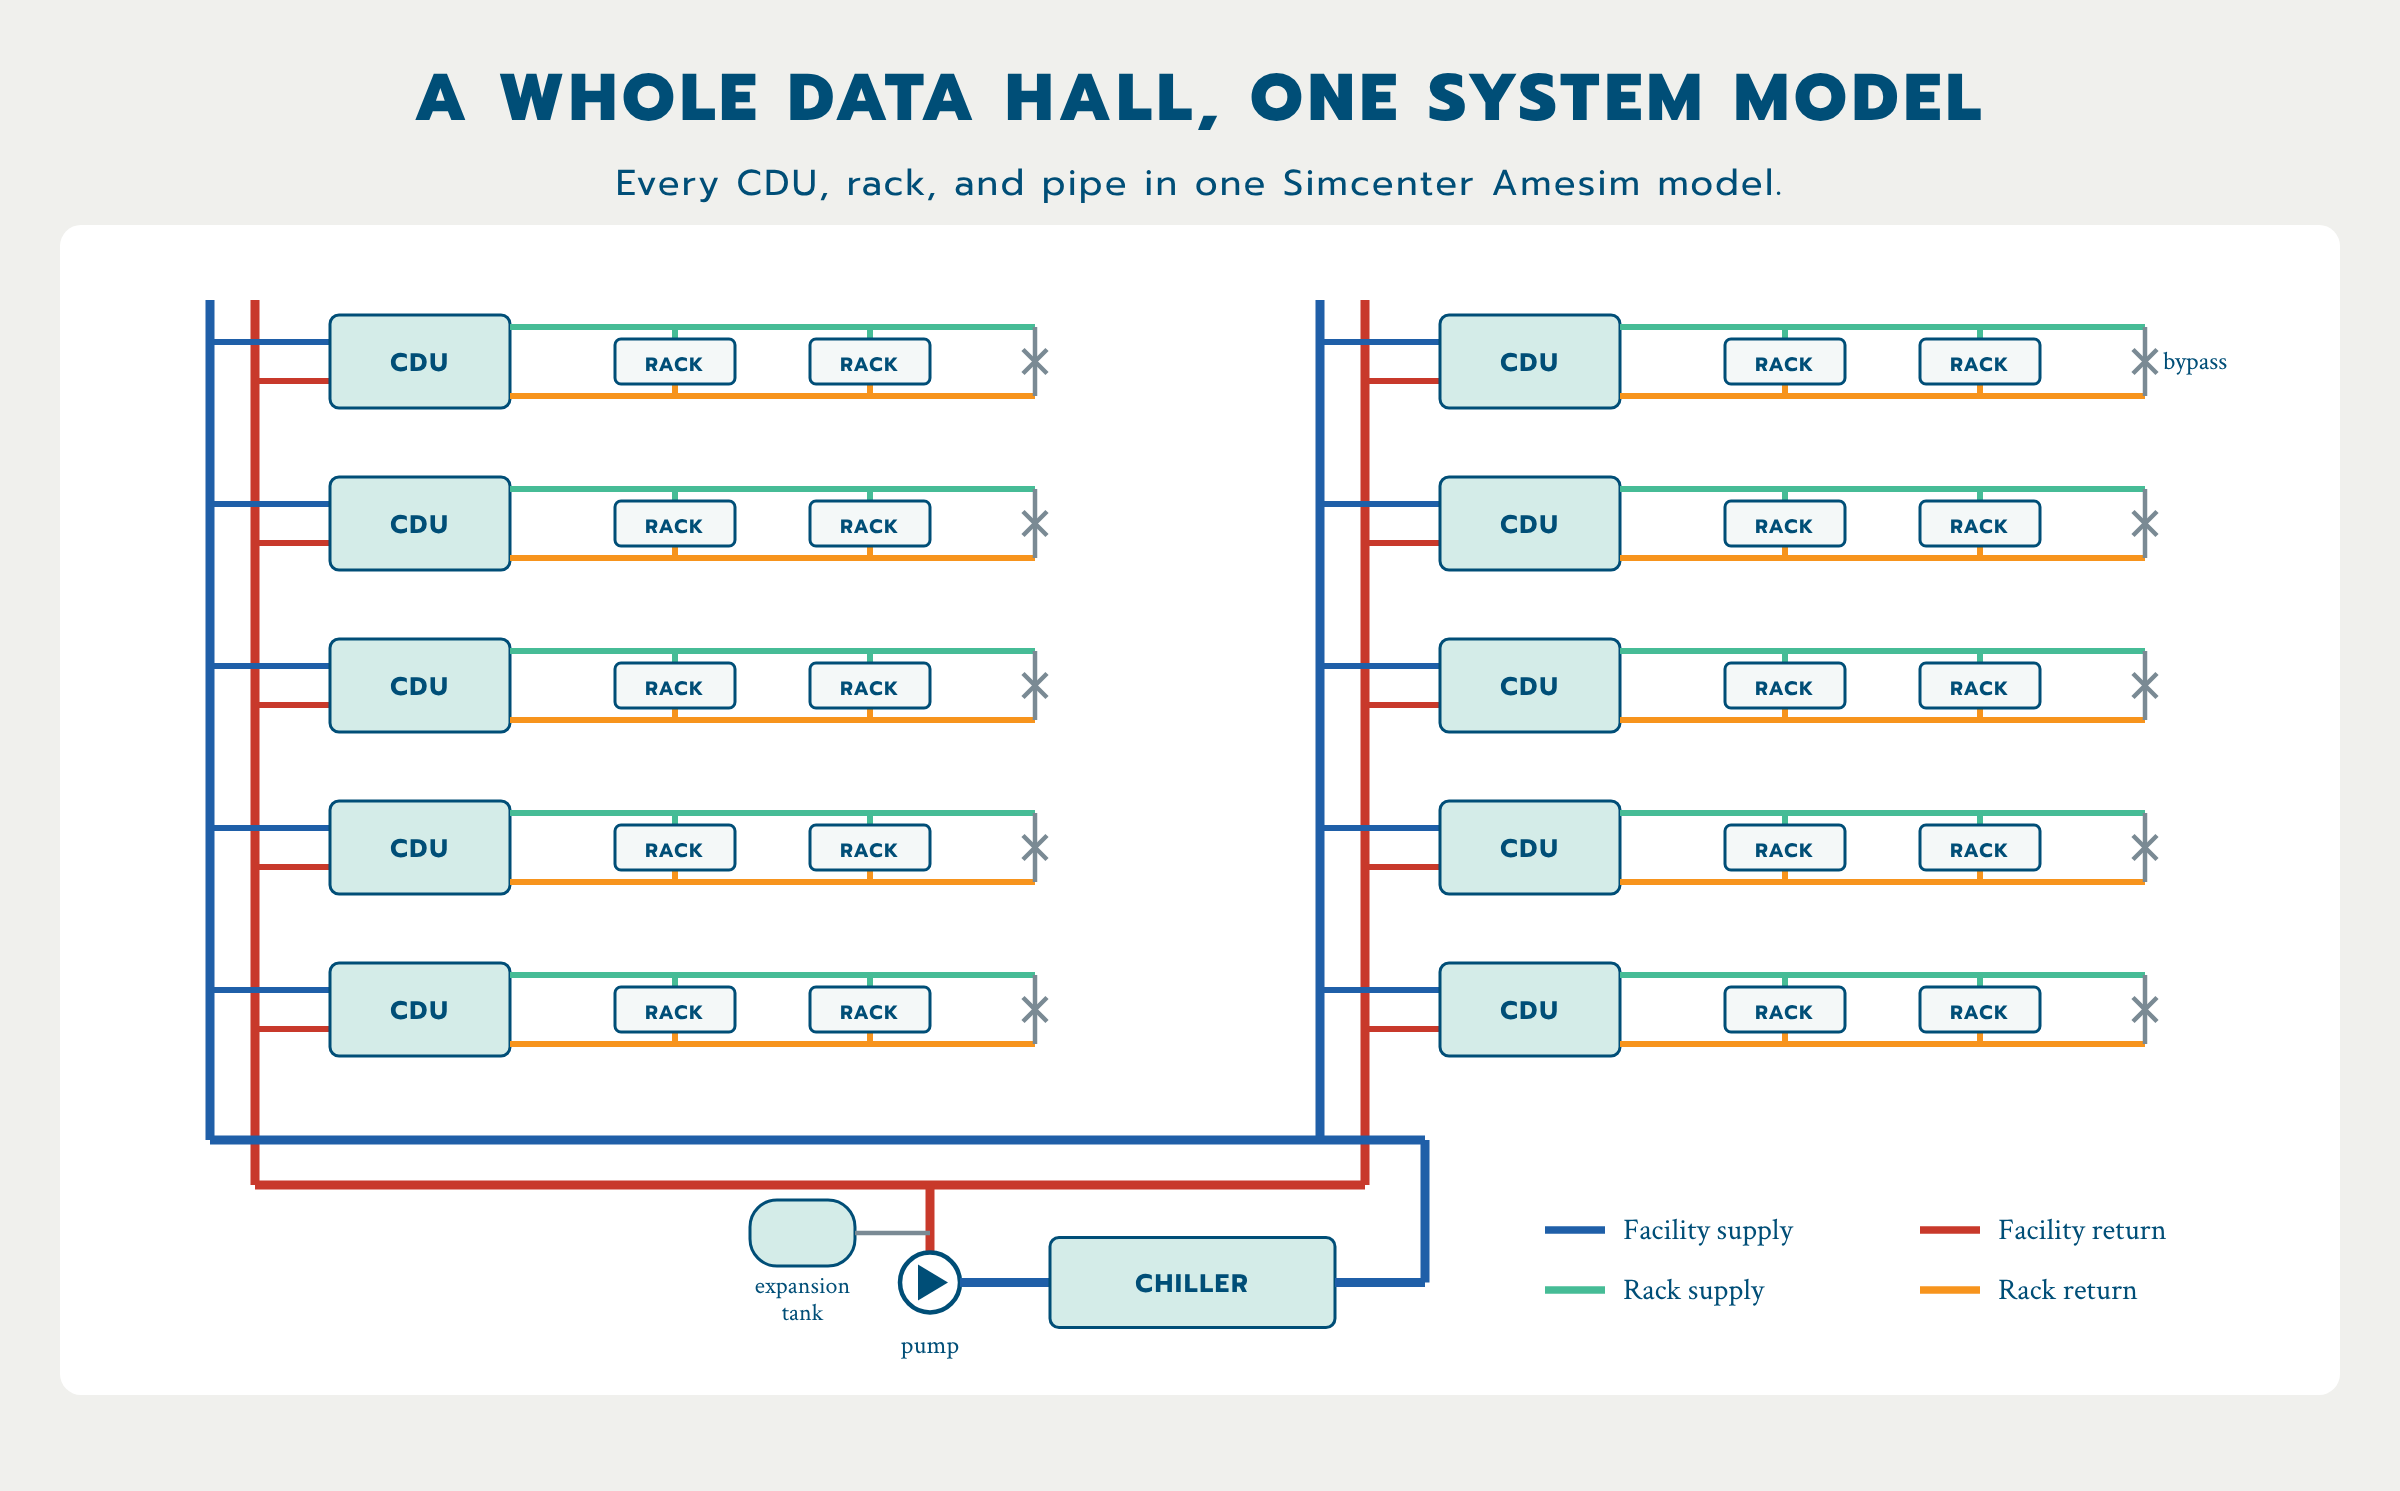
Full data hall pump trip.
We modeled a full data hall's CDU network, from the chiller to every rack, and tripped the primary pumps. The model shows how far rack temperatures rise while flow is lost, how long the excursion lasts, and how the chiller pulls the loop back down.
Other Studies We Run
Liquid cooling layout and hot-swap transients. Which cold plate arrangement (series, parallel, or mixed) best balances flow and component temperature, and what pressure surge does removing a server from a live loop cause?
Room and building response. Using weather data for your site, can the cooling system hold the space on the hottest day, and how quickly does it pull temperatures back down after an upset?
Pump and pipe sizing. Is the chilled-water loop balanced across every operating mode, including partial load and maintenance bypass?
Pressure transients. What pressure surges does a pump trip or fast valve closure cause?
Redundancy checks. If a pump, chiller, or distribution path is lost, does the remaining equipment still hold temperatures? We test the failure cases behind your redundancy design, such as N+1 or an Uptime Tier target. These studies support your design review; they are not a Tier certification.
Control sequence checks. Do the setpoints and staging logic keep supply temperature stable as IT load changes?
Thermal storage sizing. How much stored cold water does the plant need to ride through its restart sequence?
Annual energy and PUE. Which plant options lower energy and water use over a full year of weather data for your site?
How a Project Works
Scope and data request
We send a short written scope: the event we'll simulate, the outputs you'll get, and the data we need from you.
Build from your design
We build the network from your PIPE-FLO model or drawings, your equipment data, and your sequence of operations.
Assumptions for your sign-off
Every assumption, and every place the model departs from your print, is listed with the reason, so nothing is hidden.
Check the model first
Before running any event, the model must match your design flows and pressures and close its energy balance.
Run the event
We simulate the loss of utility and restart, or whatever event you need, and check the results against our own hand calculations.
Report and revise
You get a draft report, and we update it as you confirm inputs.
*Most studies take about a week once we have your data.
What You Get
A summary table of peak temperatures at every unit or cabinet, against your limits
Temperature-versus-time plots at each CDU, fan wall unit, FCU, or cabinet, plus thermal storage and chiller temperatures
System pressure versus time, including the expansion tank
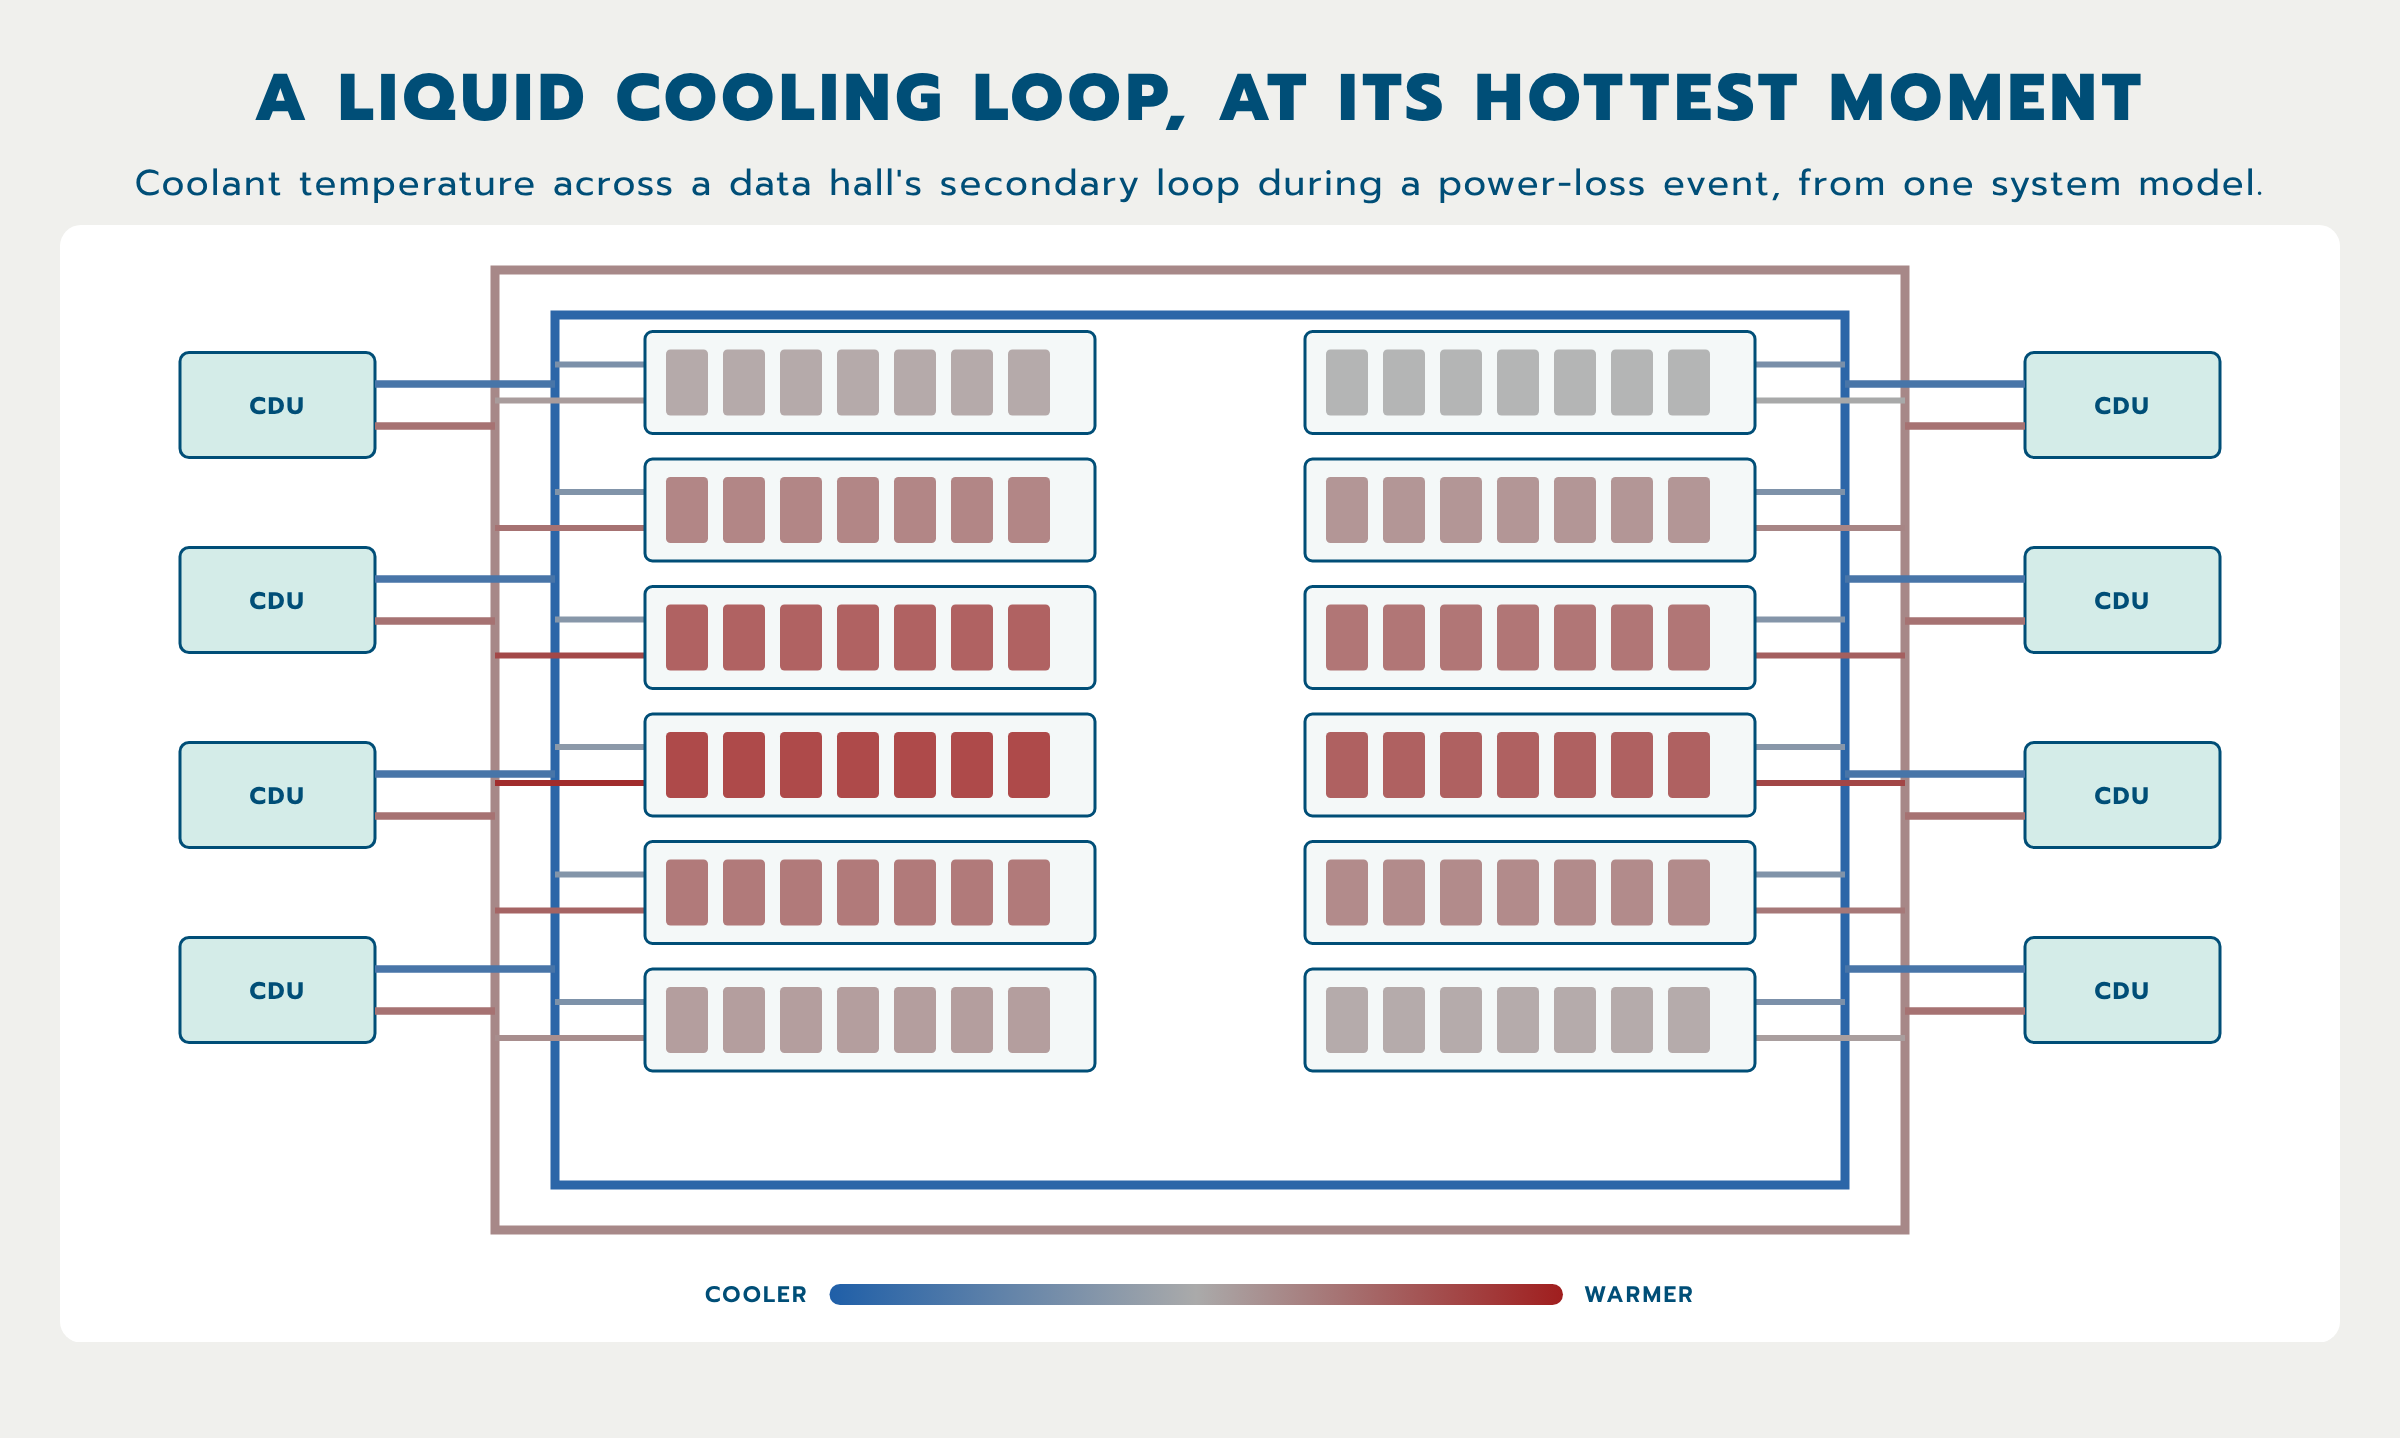
A network map of the model, colored by temperature at the hottest moment of the event
A full table of inputs, assumptions, and open questions
The documented Amesim model and training for your team, if you want to keep using it
Why Resolved Analytics?
Built for MEP design teams. We work from your PIPE-FLO model and your sequence of operations, and we report in the terms your design review needs.
Fast turnaround. Most studies take about a week once we have your data.
CFD and systems under one roof. When a question spans the plant and the room, we can pair the system model with 3D CFD.
Mission-critical focus. Data centers and other mission-critical facilities are our core work, so we know the failure scenarios that matter.
Want to run Amesim yourself?
We also sell and support Simcenter Amesim, and we can hand off a model with training.
FAQ
What is a loss-of-utility study? A loss-of-utility study simulates a power failure and recovery: pumps stop, chillers go offline and restart on their sequence, and thermal storage responds. It predicts how high coolant temperatures rise at each cooling unit or cabinet, and for how long, so you can check them against your limits.
What is systems modeling? Systems modeling, also called 1D system simulation, models how the components of a system interact over time, such as pumps, chillers, valves, heat exchangers, and controls. It predicts flows, temperatures, and pressures across the whole system without simulating the detailed 3D flow inside each part.
How is systems modeling different from CFD? CFD resolves detailed 3D flow and temperature in a space, such as where hot spots form in a room. Systems modeling covers the whole plant over time, such as how supply temperatures change after a power loss. We use both, and sometimes together.
Can you model just the liquid cooling loop? Yes. We often model the secondary loop from CDUs to cabinets in full detail and represent the chiller plant as a simpler equivalent loop.
Do you model glycol? Yes. We model water and glycol mixes, such as propylene glycol coolants, with temperature-dependent properties.
What software do you use? We build system models in Siemens Simcenter Amesim, and pair them with Simcenter STAR-CCM+ when a study needs 3D CFD.
What information do you need to start? Your PIPE-FLO model or piping drawings, the sequence of operations, unit duties and flows, chiller and thermal storage details, and your temperature limits. Where something is missing, we state an assumption and ask you to confirm it.
How long does a study take? Most studies take about a week once we have your data.
Can we keep the model after the project? Yes. We can deliver the documented Amesim model and train your team to run it. If you don't have Amesim licenses yet, we can help with that too.
Find Out How Your Cooling Systems Handles Power Loss
Send us your design and sequence of operations, and we'll scope a study that answers your real questions.
PE-led team with 20+ years of CFD experience and 300+ simulation projects delivered. Siemens Certified Expert Partner. Every project is led by an engineer with at least 10 years of simulation experience. Small enough to be flexible; experienced enough to get it right the first time.
"Beyond expectation — Resolved Analytics’ CFD models have helped our clients make very informed decisions and resulted in successful projects." — Trent Wilson, VP Operations, Power Cool Engineers, PC